Metro PCS 2011 Annual Report Download - page 126
Download and view the complete annual report
Please find page 126 of the 2011 Metro PCS annual report below. You can navigate through the pages in the report by either clicking on the pages listed below, or by using the keyword search tool below to find specific information within the annual report.-
 1
1 -
2
-
3
-
4
-
5
-
6
-
7
-
8
-
9
-
10
-
11
-
12
-
13
-
14
-
15
-
16
-
17
-
18
-
19
-
20
-
21
-
22
-
23
-
24
-
25
-
26
-
27
-
28
-
29
-
30
-
31
-
32
-
33
-
34
-
35
-
36
-
37
-
38
-
39
-
40
-
41
-
42
-
43
-
44
-
45
-
46
-
47
-
48
-
49
-
50
-
51
-
52
-
53
-
54
-
55
-
56
-
57
-
58
-
59
-
60
-
61
-
62
-
63
-
64
-
65
-
66
-
67
-
68
-
69
-
70
-
71
-
72
-
73
-
74
-
75
-
76
-
77
-
78
-
79
-
80
-
81
-
82
-
83
-
84
-
85
-
86
-
87
-
88
-
89
-
90
-
91
-
92
-
93
-
94
-
95
-
96
-
97
-
98
-
99
-
100
-
101
-
102
-
103
-
104
-
105
-
106
-
107
-
108
-
109
-
110
-
111
-
112
-
113
-
114
-
115
-
 116
116 -
 117
117 -
 118
118 -
 119
119 -
 120
120 -
 121
121 -
 122
122 -
 123
123 -
 124
124 -
 125
125 -
 126
126 -
 127
127 -
 128
128 -
 129
129 -
 130
130 -
 131
131 -
 132
132 -
 133
133 -
 134
134 -
 135
135 -
 136
136 -
137
-
138
-
139
-
140
-
141
-
142
-
143
-
144
-
145
-
146
-
147
-
148
 |
 |

MetroPCS Communications, Inc. and Subsidiaries
Notes to Consolidated Financial Statements
December 31, 2011, 2010 and 2009
F-20
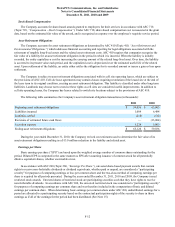
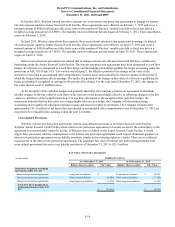
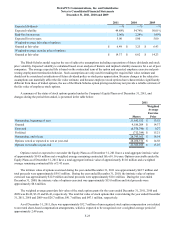
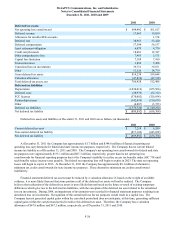
The following table summarizes the changes in fair value of the Company’s net derivative liabilities included in Level 2
assets (in thousands):
Fair Value Measurements of Net Derivative Liabilities Using Level 2 Inputs Net Derivative Liabilities
2011 2010
Beginning balance $ 8,309 $ 24,859
Total losses (realized or unrealized):
Included in earnings (1) 23,414 28,696
Included in accumulated other comprehensive loss (36,120)(12,146)
Transfers in and/or out of Level 2 — —
Purchases, sales, issuances and settlements — —
Ending balance $ 21,015 $ 8,309
————————————
(1) Losses included in earnings that are attributable to the reclassification of the effective portion of those derivative liabilities still held at the reporting
date as reported in interest expense in the consolidated statements of income and comprehensive income.
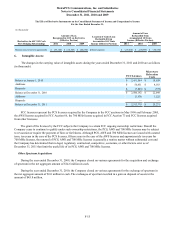
The following table summarizes the changes in fair value of the Company’s Level 3 assets (in thousands):
Fair Value Measurements of Assets Using Level 3 Inputs Long-Term Investments
2011 2010
Beginning balance $ 6,319 $ 6,319
Total losses (realized or unrealized):
Included in earnings — —
Included in accumulated other comprehensive income (loss) — —
Transfers in and/or out of Level 3 — —
Purchases, sales, issuances and settlements — —
Ending balance $ 6,319 $ 6,319
The carrying value of the Company’s financial instruments, with the exception of long-term debt including current
maturities, reasonably approximate the related fair values as of December 31, 2011 and 2010. The fair value of the Company’s
long-term debt, excluding capital lease obligations, is estimated based on the quoted market prices for the same or similar
issues or on the current rates offered to the Company for debt of the same remaining maturities. As of December 31, 2011, the
carrying value and fair value of long-term debt, including current maturities, were $4.5 billion and approximately $4.4 billion,
respectively. As of December 31, 2010, the carrying value and fair value of long-term debt, including current maturities, were
$3.5 billion and $3.5 billion, respectively.
Although the Company has determined the estimated fair value amounts using available market information and
commonly accepted valuation methodologies, considerable judgment is required in interpreting market data to develop fair
value estimates. The fair value estimates are based on information available at December 31, 2011 and 2010 and have not been
revalued since those dates. As such, the Company’s estimates are not necessarily indicative of the amount that the Company, or
holders of the instruments, could realize in a current market exchange and current estimates of fair value could differ
significantly.
10. Concentrations:
The Company purchases a substantial portion of its wireless infrastructure equipment and handset equipment from only a
few major suppliers. Further, the Company generally relies on one or two key vendors in each of the following areas: network
infrastructure equipment, billing services, payment services, customer care, handset logistics, roaming services and long
distance services. Loss of any of these suppliers could adversely affect operations temporarily until a comparable substitute
could be found.
Local and long distance telephone and other companies provide certain communication services to the Company.
Disruption of these services could adversely affect operations in the short term until an alternative telecommunication provider
was found.