Metro PCS 2011 Annual Report Download - page 135
Download and view the complete annual report
Please find page 135 of the 2011 Metro PCS annual report below. You can navigate through the pages in the report by either clicking on the pages listed below, or by using the keyword search tool below to find specific information within the annual report.-
 1
1 -
2
-
3
-
4
-
5
-
6
-
7
-
8
-
9
-
10
-
11
-
12
-
13
-
14
-
15
-
16
-
17
-
18
-
19
-
20
-
21
-
22
-
23
-
24
-
25
-
26
-
27
-
28
-
29
-
30
-
31
-
32
-
33
-
34
-
35
-
36
-
37
-
38
-
39
-
40
-
41
-
42
-
43
-
44
-
45
-
46
-
47
-
48
-
49
-
50
-
51
-
52
-
53
-
54
-
55
-
56
-
57
-
58
-
59
-
60
-
61
-
62
-
63
-
64
-
65
-
66
-
67
-
68
-
69
-
70
-
71
-
72
-
73
-
74
-
75
-
76
-
77
-
78
-
79
-
80
-
81
-
82
-
83
-
84
-
85
-
86
-
87
-
88
-
89
-
90
-
91
-
92
-
93
-
94
-
95
-
96
-
97
-
98
-
99
-
100
-
101
-
102
-
103
-
104
-
105
-
106
-
107
-
108
-
109
-
110
-
111
-
112
-
113
-
114
-
115
-
116
-
117
-
118
-
119
-
120
-
121
-
122
-
123
-
124
-
 125
125 -
 126
126 -
 127
127 -
 128
128 -
 129
129 -
 130
130 -
 131
131 -
 132
132 -
 133
133 -
 134
134 -
 135
135 -
 136
136 -
 137
137 -
 138
138 -
 139
139 -
 140
140 -
 141
141 -
 142
142 -
 143
143 -
 144
144 -
 145
145 -
146
-
147
-
148
 |
 |

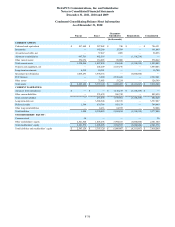
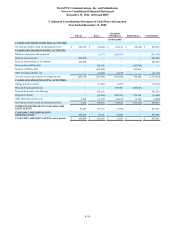
MetroPCS Communications, Inc. and Subsidiaries
Notes to Consolidated Financial Statements
December 31, 2011, 2010 and 2009
F-29
Condensed Consolidating Balance Sheet Information
As of December 31, 2011
Parent Issuer Guarantor
Subsidiaries Eliminations Consolidated
(in thousands)
CURRENT ASSETS:
Cash and cash equivalents $ 657,289 $ 1,285,266 $ 727 $ — $ 1,943,282
Inventories — 226,124 13,524 — 239,648
Accounts receivable, net — 77,396 627 — 78,023
Advances to subsidiaries 671,193 245,866 — (917,059) —
Other current assets 300,068 102,845 79,727 — 482,640
Total current assets 1,628,550 1,937,497 94,605 (917,059) 2,743,593
Property and equipment, net — 1,378 4,016,621 — 4,017,999
Long-term investments 6,319 — — — 6,319
Investment in subsidiaries 1,297,957 4,728,985 — (6,026,942) —
FCC licenses — 3,800 2,535,241 — 2,539,041
Other assets — 137,985 39,612 (1,618) 175,979
Total assets $ 2,932,826 $ 6,809,645 $ 6,686,079 $ (6,945,619) $ 9,482,931
CURRENT LIABILITIES:
Advances from subsidiaries $ — $ — $ 917,059 $ (917,059) $ —
Other current liabilities — 243,247 573,476 — 816,723
Total current liabilities — 243,247 1,490,535 (917,059) 816,723
Long-term debt, net — 4,437,924 273,097 — 4,711,021
Deferred credits 5,226 813,498 120,028 (1,618) 937,134
Other long-term liabilities — 17,019 73,434 — 90,453
Total liabilities 5,226 5,511,688 1,957,094 (918,677) 6,555,331
STOCKHOLDERS’ EQUITY:
Common stock 36 — — — 36
Other stockholders’ equity 2,927,564 1,297,957 4,728,985 (6,026,942) 2,927,564
Total stockholders’ equity 2,927,600 1,297,957 4,728,985 (6,026,942) 2,927,600
Total liabilities and stockholders’ equity $ 2,932,826 $ 6,809,645 $ 6,686,079 $ (6,945,619) $ 9,482,931