Metro PCS 2011 Annual Report Download - page 109
Download and view the complete annual report
Please find page 109 of the 2011 Metro PCS annual report below. You can navigate through the pages in the report by either clicking on the pages listed below, or by using the keyword search tool below to find specific information within the annual report.-
 1
1 -
2
-
3
-
4
-
5
-
6
-
7
-
8
-
9
-
10
-
11
-
12
-
13
-
14
-
15
-
16
-
17
-
18
-
19
-
20
-
21
-
22
-
23
-
24
-
25
-
26
-
27
-
28
-
29
-
30
-
31
-
32
-
33
-
34
-
35
-
36
-
37
-
38
-
39
-
40
-
41
-
42
-
43
-
44
-
45
-
46
-
47
-
48
-
49
-
50
-
51
-
52
-
53
-
54
-
55
-
56
-
57
-
58
-
59
-
60
-
61
-
62
-
63
-
64
-
65
-
66
-
67
-
68
-
69
-
70
-
71
-
72
-
73
-
74
-
75
-
76
-
77
-
78
-
79
-
80
-
81
-
82
-
83
-
84
-
85
-
86
-
87
-
88
-
89
-
90
-
91
-
92
-
93
-
94
-
95
-
96
-
97
-
98
-
 99
99 -
 100
100 -
 101
101 -
 102
102 -
 103
103 -
 104
104 -
 105
105 -
 106
106 -
 107
107 -
 108
108 -
 109
109 -
 110
110 -
 111
111 -
 112
112 -
 113
113 -
 114
114 -
 115
115 -
 116
116 -
 117
117 -
 118
118 -
 119
119 -
120
-
121
-
122
-
123
-
124
-
125
-
126
-
127
-
128
-
129
-
130
-
131
-
132
-
133
-
134
-
135
-
136
-
137
-
138
-
139
-
140
-
141
-
142
-
143
-
144
-
145
-
146
-
147
-
148
 |
 |
F-3
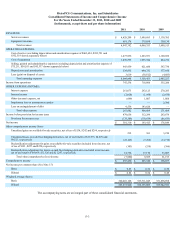
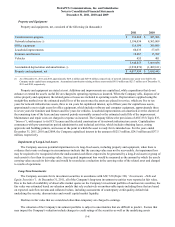
MetroPCS Communications, Inc. and Subsidiaries
Consolidated Statements of Income and Comprehensive Income
For the Years Ended December 31, 2011, 2010 and 2009
(in thousands, except share and per share information)
2011 2010 2009
REVENUES:
Service revenues $ 4,428,208 $ 3,689,695 $ 3,130,385
Equipment revenues 419,174 379,658 350,130
Total revenues 4,847,382 4,069,353 3,480,515
OPERATING EXPENSES:
Cost of service (excluding depreciation and amortization expense of $463,624, $393,721 and
$332,319 shown separately below) 1,473,836 1,223,931 1,120,052
Cost of equipment 1,439,595 1,093,944 884,272
Selling, general and administrative expenses (excluding depreciation and amortization expense of
$75,211, $56,011 and $45,537 shown separately below) 643,959 621,660 567,730
Depreciation and amortization 538,835 449,732 377,856
Loss (gain) on disposal of assets 3,619 (38,812) (4,683)
Total operating expenses 4,099,844 3,350,455 2,945,227
Income from operations 747,538 718,898 535,288
OTHER EXPENSE (INCOME):
Interest expense 261,073 263,125 270,285
Interest income (2,028) (1,954) (2,870)
Other (income) expense, net (699) 1,807 1,808
Impairment loss on investment securities — — 2,386
Loss on extinguishment of debt 9,536 143,626 —
Total other expense 267,882 406,604 271,609
Income before provision for income taxes 479,656 312,294 263,679
Provision for income taxes (178,346) (118,879) (86,835)
Net income $ 301,310 $ 193,415 $ 176,844
Other comprehensive income (loss):
Unrealized gains on available-for-sale securities, net of tax of $134, $242 and $294, respectively 212 361 3,210
Unrealized losses on cash flow hedging derivatives, net of tax benefit of $13,975, $4,879 and
$9,521, respectively (22,145) (7,268) (14,710)
Reclassification adjustment for gains on available-for-sale securities included in net income, net
of tax of $191, $227 and $250, respectively (303) (338) (394)
Reclassification adjustment for losses on cash flow hedging derivatives included in net income,
net of tax benefit of $9,059, $11,526 and $21,247, respectively 14,356 17,170 33,087
Total other comprehensive (loss) income (7,880) 9,925 21,193
Comprehensive income $ 293,430 $ 203,340 $ 198,037
Net income per common share (See Note 15):
Basic $ 0.83 $ 0.54 $ 0.50
Diluted $ 0.82 $ 0.54 $ 0.49
Weighted average shares:
Basic 360,410,168 353,711,045 351,898,898
Diluted 363,837,940 356,135,089 355,942,921
The accompanying notes are an integral part of these consolidated financial statements.