Metro PCS 2011 Annual Report Download - page 86
Download and view the complete annual report
Please find page 86 of the 2011 Metro PCS annual report below. You can navigate through the pages in the report by either clicking on the pages listed below, or by using the keyword search tool below to find specific information within the annual report.-
 1
1 -
2
-
3
-
4
-
5
-
6
-
7
-
8
-
9
-
10
-
11
-
12
-
13
-
14
-
15
-
16
-
17
-
18
-
19
-
20
-
21
-
22
-
23
-
24
-
25
-
26
-
27
-
28
-
29
-
30
-
31
-
32
-
33
-
34
-
35
-
36
-
37
-
38
-
39
-
40
-
41
-
42
-
43
-
44
-
45
-
46
-
47
-
48
-
49
-
50
-
51
-
52
-
53
-
54
-
55
-
56
-
57
-
58
-
59
-
60
-
61
-
62
-
63
-
64
-
65
-
66
-
67
-
68
-
69
-
70
-
71
-
72
-
73
-
74
-
75
-
 76
76 -
 77
77 -
 78
78 -
 79
79 -
 80
80 -
 81
81 -
 82
82 -
 83
83 -
 84
84 -
 85
85 -
 86
86 -
 87
87 -
 88
88 -
 89
89 -
 90
90 -
 91
91 -
 92
92 -
 93
93 -
 94
94 -
 95
95 -
 96
96 -
97
-
98
-
99
-
100
-
101
-
102
-
103
-
104
-
105
-
106
-
107
-
108
-
109
-
110
-
111
-
112
-
113
-
114
-
115
-
116
-
117
-
118
-
119
-
120
-
121
-
122
-
123
-
124
-
125
-
126
-
127
-
128
-
129
-
130
-
131
-
132
-
133
-
134
-
135
-
136
-
137
-
138
-
139
-
140
-
141
-
142
-
143
-
144
-
145
-
146
-
147
-
148
 |
 |
75
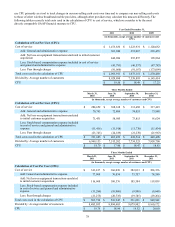
identified, including handset upgrade transactions, are excluded, as these costs are incurred specifically for existing customers.
CPGA costs increased to $173.11 for the year ended December 31, 2011 from $157.26 for the year ended December 31, 2010.
The increase in CPGA for the year ended December 31, 2011, when compared to the same period in 2010, was primarily driven
by increased promotional activities. CPGA costs increased to $157.26 for the year ended December 31, 2010 from $145.79 for
the year ended December 31, 2009. This increase in CPGA was primarily driven by various promotional activities as well as
lower gross additions.
Cost Per User. CPU is determined by dividing (a) cost of service and general and administrative costs (excluding
applicable stock-based compensation expense included in cost of service and general and administrative expense) plus net loss
on handset equipment transactions unrelated to initial customer acquisition, divided by (b) the sum of the average monthly
number of customers during such period. CPU for the year ended December 31, 2011 and 2010 was $19.56 and $18.49,
respectively. The $1.07 increase in CPU for the year ended December 31, 2011 was primarily driven by the increase in
retention expense related to existing customers, costs associated with our 4G LTE network upgrade and roaming expenses
associated with Metro USA, offset by the continued scaling of our business. CPU for the year ended December 31, 2009 was
$17.23. The $1.26 increase in CPU for the year ended December 31, 2010 was primarily driven by the increase in handset
subsidies for upgrades by existing customers, the inclusion of regulatory fees in our Wireless for All service plans as well as
costs associated with our 4G LTE network upgrade.
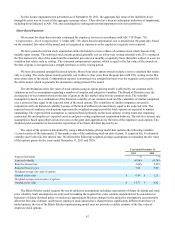
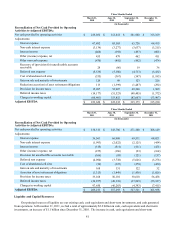
Adjusted EBITDA. Adjusted EBITDA is defined as consolidated net income plus depreciation and amortization; gain
(loss) on disposal of assets; stock-based compensation expense; gain (loss) on extinguishment of debt; provision for income
taxes; interest expense; minus interest and other income and non-cash items increasing consolidated net income. Adjusted
EBITDA for the year ended December 31, 2011 increased to approximately $1.3 billion from approximately $1.2 billion for the
year ended December 31, 2010 and $956.2 million for the year ended December 31, 2009.
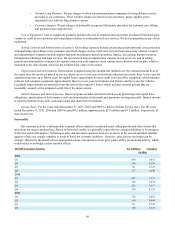
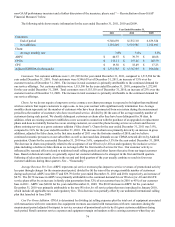
The following table shows consolidated quarterly metric information for the years ended December 31, 2010 and 2011.
Three Months Ended
March 31,
2010 June 30,
2010 September 30,
2010 December 31,
2010 March 31,
2011 June 30,
2011 September 30,
2011 December 31,
2011
Customers:
End of period 7,331,126 7,634,135 7,857,384 8,155,110 8,881,055 9,079,865 9,149,249 9,346,659
Net additions 691,602 303,009 223,249 297,726 725,945 198,810 69,384 197,410
Churn:
Average monthly rate 3.7% 3.3% 3.8% 3.5% 3.1% 3.9% 4.5% 3.7%
ARPU $ 39.83 $ 39.84 $ 39.69 $ 39.79 $ 40.42 $ 40.49 $ 40.80 $ 40.55
CPGA $ 146.18 $ 164.29 $ 160.54 $ 161.88 $ 157.28 $ 177.88 $ 193.95 $ 165.79
CPU $ 18.79 $ 17.90 $ 18.47 $ 18.83 $ 19.79 $ 18.94 $ 19.52 $ 20.00
Adjusted EBITDA (in thousands) $ 223,620 $ 322,332 $ 315,175 $ 315,230 $ 285,211 $ 357,293 $ 327,321 $ 361,958
Reconciliation of non-GAAP Financial Measures
We utilize certain financial measures and key performance indicators that are not calculated in accordance with GAAP to
assess our financial and operating performance. A non-GAAP financial measure is defined as a numerical measure of a
company’s financial performance that (i) excludes amounts, or is subject to adjustments that have the effect of excluding
amounts, that are included in the comparable measure calculated and presented in accordance with GAAP in the statement of
income or statement of cash flows, or (ii) includes amounts, or is subject to adjustments that have the effect of including
amounts, that are excluded from the comparable measure so calculated and presented.
ARPU, CPGA, CPU and Adjusted EBITDA are non-GAAP financial measures utilized by our management to judge our
ability to meet our liquidity requirements and to evaluate our operating performance. We believe these measures are important
in understanding the performance of our operations from period to period, and although every company in the wireless industry
does not define each of these measures in precisely the same way, we believe that these measures (which are common in the
wireless industry) facilitate key liquidity and operating performance comparisons with other companies in the wireless industry.
The following tables reconcile our non-GAAP financial measures with our financial statements presented in accordance with
GAAP.
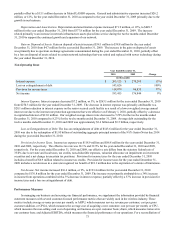
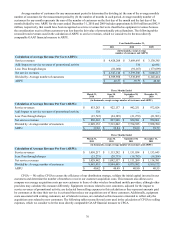
ARPU — We utilize ARPU to evaluate our per-customer service revenue realization and to assist in forecasting our future
service revenues. ARPU is calculated exclusive of pass through charges that we collect from our customers and remit to the
appropriate government agencies.