Metro PCS 2011 Annual Report Download - page 111
Download and view the complete annual report
Please find page 111 of the 2011 Metro PCS annual report below. You can navigate through the pages in the report by either clicking on the pages listed below, or by using the keyword search tool below to find specific information within the annual report.-
 1
1 -
2
-
3
-
4
-
5
-
6
-
7
-
8
-
9
-
10
-
11
-
12
-
13
-
14
-
15
-
16
-
17
-
18
-
19
-
20
-
21
-
22
-
23
-
24
-
25
-
26
-
27
-
28
-
29
-
30
-
31
-
32
-
33
-
34
-
35
-
36
-
37
-
38
-
39
-
40
-
41
-
42
-
43
-
44
-
45
-
46
-
47
-
48
-
49
-
50
-
51
-
52
-
53
-
54
-
55
-
56
-
57
-
58
-
59
-
60
-
61
-
62
-
63
-
64
-
65
-
66
-
67
-
68
-
69
-
70
-
71
-
72
-
73
-
74
-
75
-
76
-
77
-
78
-
79
-
80
-
81
-
82
-
83
-
84
-
85
-
86
-
87
-
88
-
89
-
90
-
91
-
92
-
93
-
94
-
95
-
96
-
97
-
98
-
99
-
100
-
 101
101 -
 102
102 -
 103
103 -
 104
104 -
 105
105 -
 106
106 -
 107
107 -
 108
108 -
 109
109 -
 110
110 -
 111
111 -
 112
112 -
 113
113 -
 114
114 -
 115
115 -
 116
116 -
 117
117 -
 118
118 -
 119
119 -
 120
120 -
 121
121 -
122
-
123
-
124
-
125
-
126
-
127
-
128
-
129
-
130
-
131
-
132
-
133
-
134
-
135
-
136
-
137
-
138
-
139
-
140
-
141
-
142
-
143
-
144
-
145
-
146
-
147
-
148
 |
 |

F-5
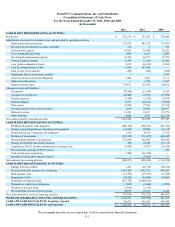
MetroPCS Communications, Inc. and Subsidiaries
Consolidated Statements of Cash Flows
For the Years Ended December 31, 2011, 2010 and 2009
(in thousands)
2011 2010 2009
CASH FLOWS FROM OPERATING ACTIVITIES:
Net income $ 301,310 $ 193,415 $ 176,844
Adjustments to reconcile net income to net cash provided by operating activities:
Depreciation and amortization 538,835 449,732 377,856
Provision for uncollectible accounts receivable 518 2 199
Deferred rent expense 18,828 21,080 24,222
Cost of abandoned cell sites 1,099 2,633 8,286
Stock-based compensation expense 41,791 46,537 47,783
Non-cash interest expense 6,595 13,264 11,309
Loss (gain) on disposal of assets 3,619 (38,812) (4,683)
Loss on extinguishment of debt 9,536 143,626 —
Gain on sale of investments (493) (566) (644)
Impairment loss on investment securities — — 2,386
Accretion of asset retirement obligations 5,224 3,063 5,111
Other non-cash expense — 1,929 1,567
Deferred income taxes 174,617 115,478 110,161
Changes in assets and liabilities:
Inventories (78,599) (13,648) 8,554
Accounts receivable, net (20,485) (6,523) (17,056)
Prepaid expenses (5,244) (3,368) (8,438)
Deferred charges 8,515 (24,071) (9,698)
Other assets 24,380 17,896 23,318
Accounts payable and accrued expenses 1,919 30,946 128,167
Deferred revenue 21,234 36,817 35,779
Other liabilities 8,609 5,070 (21,674)
Net cash provided by operating activities 1,061,808 994,500 899,349
CASH FLOWS FROM INVESTING ACTIVITIES:
Purchases of property and equipment (889,769) (790,385) (831,674)
Change in prepaid purchases of property and equipment (61,815) 28,200 (33,115)
Proceeds from sale of property and equipment 1,118 8,793 5,330
Purchase of investments (599,765) (711,827) (486,645)
Proceeds from maturity of investments 675,000 562,500 262,500
Change in restricted cash and investments 300 12,018 (15,113)
Acquisitions of FCC licenses and microwave clearing costs (4,445) (8,873) (19,186)
Proceeds from exchange of FCC licenses — — 949
Cash used in asset acquisitions (7,495) (41,059) —
Purchase of redeemable minority interest — (9,785) —
Net cash used in investing activities (886,871) (950,418) (1,116,954)
CASH FLOWS FROM FINANCING ACTIVITIES:
Change in book overdraft 3,445 (82,712) (20,314)
Proceeds from debt issuance, net of discount 1,497,500 1,992,770 492,250
Debt issuance costs (15,351) (35,353) (11,925)
Repayment of debt (24,292) (16,000) (16,000)
Retirement of long-term debt (535,792) (2,040,186) —
Payments on capital lease obligations (7,855) (3,660) (3,599)
Purchase of treasury stock (4,918) (1,914) —
Proceeds from exercise of stock options 59,077 10,123 8,626
Net cash provided by (used in) financing activities 971,814 (176,932) 449,038
INCREASE (DECREASE) CASH AND CASH EQUIVALENTS 1,146,751 (132,850) 231,433
CASH AND CASH EQUIVALENTS, beginning of period 796,531 929,381 697,948
CASH AND CASH EQUIVALENTS, end of period $ 1,943,282 $ 796,531 $ 929,381
The accompanying notes are an integral part of these consolidated financial statements.