Metro PCS 2011 Annual Report Download - page 80
Download and view the complete annual report
Please find page 80 of the 2011 Metro PCS annual report below. You can navigate through the pages in the report by either clicking on the pages listed below, or by using the keyword search tool below to find specific information within the annual report.-
 1
1 -
2
-
3
-
4
-
5
-
6
-
7
-
8
-
9
-
10
-
11
-
12
-
13
-
14
-
15
-
16
-
17
-
18
-
19
-
20
-
21
-
22
-
23
-
24
-
25
-
26
-
27
-
28
-
29
-
30
-
31
-
32
-
33
-
34
-
35
-
36
-
37
-
38
-
39
-
40
-
41
-
42
-
43
-
44
-
45
-
46
-
47
-
48
-
49
-
50
-
51
-
52
-
53
-
54
-
55
-
56
-
57
-
58
-
59
-
60
-
61
-
62
-
63
-
64
-
65
-
66
-
67
-
68
-
69
-
 70
70 -
 71
71 -
 72
72 -
 73
73 -
 74
74 -
 75
75 -
 76
76 -
 77
77 -
 78
78 -
 79
79 -
 80
80 -
 81
81 -
 82
82 -
 83
83 -
 84
84 -
 85
85 -
 86
86 -
 87
87 -
 88
88 -
 89
89 -
 90
90 -
91
-
92
-
93
-
94
-
95
-
96
-
97
-
98
-
99
-
100
-
101
-
102
-
103
-
104
-
105
-
106
-
107
-
108
-
109
-
110
-
111
-
112
-
113
-
114
-
115
-
116
-
117
-
118
-
119
-
120
-
121
-
122
-
123
-
124
-
125
-
126
-
127
-
128
-
129
-
130
-
131
-
132
-
133
-
134
-
135
-
136
-
137
-
138
-
139
-
140
-
141
-
142
-
143
-
144
-
145
-
146
-
147
-
148
 |
 |
69
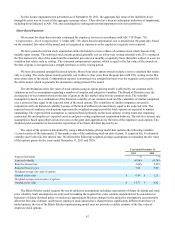
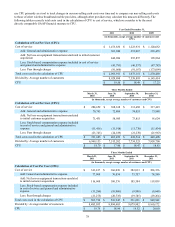
• Variable Long Distance. We pay charges to other telecommunications companies for long distance service
provided to our customers. These variable charges are based on our customers’ usage, applied at pre-
negotiated rates with the long distance carriers.
• Customer Support. We pay charges to nationally recognized third-party providers for customer care, billing
and payment processing services.
Cost of Equipment. Cost of equipment primarily includes the cost of handsets and accessories purchased from third-party
vendors to resell to our customers and independent retailers in connection with our services. We do not manufacture any of this
equipment.
Selling, General and Administrative Expenses. Our selling expenses include advertising and promotional costs associated
with marketing and selling to new customers and fixed charges such as retail store rent and retail associates’ salaries. General
and administrative expenses include support functions including technical operations, finance, accounting, human resources,
information technology and legal services. We record stock-based compensation expense in cost of service and in selling,
general and administrative expenses for expense associated with employee stock options and restricted stock awards, which is
measured at the date of grant, based on the estimated fair value of the award.
Depreciation and Amortization. Depreciation is applied using the straight-line method over the estimated useful lives of
the assets once the assets are placed in service, which are six to ten years for network infrastructure assets, three to ten years for
capitalized interest, up to fifteen years for capital leases, approximately one to eight years for office equipment, which includes
software and computer equipment, approximately three to seven years for furniture and fixtures and five years for vehicles.
Leasehold improvements are amortized over the term of the respective leases, which includes renewal periods that are
reasonably assured, or the estimated useful life of the improvement.
Interest Expense and Interest Income. Interest expense includes interest incurred on our borrowings and capital lease
obligations, amortization of debt issuance costs and amortization of discounts and premiums on long-term debt. Interest income
is earned primarily on our cash, cash equivalents and short-term investments.
Income Taxes. For the years ended December 31, 2011, 2010 and 2009 we paid no federal income taxes. For the years
ended December 31, 2011, 2010 and 2009 we paid $4.5 million, approximately $2.9 million and $3.1 million, respectively, of
state income tax.
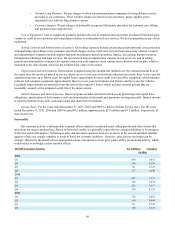
Seasonality
Our customer activity is influenced by seasonal effects related to traditional retail selling periods and other factors that
arise from our target customer base. Based on historical results, we generally expect the net customer additions to be strongest
in the first and fourth quarters. Softening of sales and increased customer turnover, or churn, in the second and third calendar
quarters of the year usually combine to result in fewer net customer additions. However, sales activity and churn can be
strongly affected by the launch of new metropolitan areas, introduction of new price plans, and by promotional activity, which
could reduce or outweigh certain seasonal effects.
MetroPCS Customer Statistics Net Additions Customers
(In 000s)
2009
Q1 684 6,051
Q2 206 6,256
Q3 66 6,322
Q4 317 6,640
2010
Q1 691 7,331
Q2 303 7,634
Q3 223 7,857
Q4 298 8,155
2011
Q1 726 8,881
Q2 199 9,080
Q3 69 9,149
Q4 198 9,347