Metro PCS 2011 Annual Report Download - page 110
Download and view the complete annual report
Please find page 110 of the 2011 Metro PCS annual report below. You can navigate through the pages in the report by either clicking on the pages listed below, or by using the keyword search tool below to find specific information within the annual report.-
 1
1 -
2
-
3
-
4
-
5
-
6
-
7
-
8
-
9
-
10
-
11
-
12
-
13
-
14
-
15
-
16
-
17
-
18
-
19
-
20
-
21
-
22
-
23
-
24
-
25
-
26
-
27
-
28
-
29
-
30
-
31
-
32
-
33
-
34
-
35
-
36
-
37
-
38
-
39
-
40
-
41
-
42
-
43
-
44
-
45
-
46
-
47
-
48
-
49
-
50
-
51
-
52
-
53
-
54
-
55
-
56
-
57
-
58
-
59
-
60
-
61
-
62
-
63
-
64
-
65
-
66
-
67
-
68
-
69
-
70
-
71
-
72
-
73
-
74
-
75
-
76
-
77
-
78
-
79
-
80
-
81
-
82
-
83
-
84
-
85
-
86
-
87
-
88
-
89
-
90
-
91
-
92
-
93
-
94
-
95
-
96
-
97
-
98
-
99
-
 100
100 -
 101
101 -
 102
102 -
 103
103 -
 104
104 -
 105
105 -
 106
106 -
 107
107 -
 108
108 -
 109
109 -
 110
110 -
 111
111 -
 112
112 -
 113
113 -
 114
114 -
 115
115 -
 116
116 -
 117
117 -
 118
118 -
 119
119 -
 120
120 -
121
-
122
-
123
-
124
-
125
-
126
-
127
-
128
-
129
-
130
-
131
-
132
-
133
-
134
-
135
-
136
-
137
-
138
-
139
-
140
-
141
-
142
-
143
-
144
-
145
-
146
-
147
-
148
 |
 |

F-4
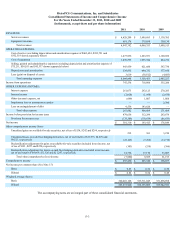
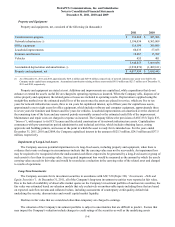
MetroPCS Communications, Inc. and Subsidiaries
Consolidated Statements of Stockholders' Equity
For the Years Ended December 31, 2011, 2010 and 2009
(in thousands, except share information)
Number of
Common
Shares Amount
Number of
Treasury
Shares Amount
Additional
Paid-In
Capital Retained
Earnings
Accumulated
Other
Comprehensive
Loss Total
BALANCE, January 1, 2009 350,918,272 $ 35 — $ — $ 1,578,972 $ 487,849 $ (32,533) $ 2,034,323
Exercise of Common Stock options 1,792,991 — — — 8,626 — — 8,626
Stock-based compensation expense — — — — 47,905 — — 47,905
Tax impact of Common Stock option forfeitures — — — — (749) — — (749)
Net income — — — — — 176,844 — 176,844
Unrealized gains on available-for-sale securities — — — — — — 3,210 3,210
Unrealized losses on cash flow hedging
derivatives — — — — — — (14,710)(14,710)
Reclassification adjustment for gains on
available-for-sale securities included in net
income — — — — — — (394)(394)
Reclassification adjustment for losses on cash
flow hedging derivatives included in net income — — — — — — 33,087 33,087
BALANCE, December 31, 2009 352,711,263 $ 35 — $ — $ 1,634,754 $ 664,693 $ (11,340) $ 2,288,142
Exercise of Common Stock options 2,255,318 1 — — 10,122 — — 10,123
Restricted Common Stock vested and issued 589,903 — — — — — — —
Stock-based compensation expense — — — — 46,537 — — 46,537
Tax impact of Common Stock option and
restricted stock forfeitures — — — — (4,652) — — (4,652)
Purchase of Treasury Stock (237,818) — 237,818 (1,914) — — — (1,914)
Net income — — — — — 193,415 — 193,415
Unrealized gains on available-for-sale securities — — — — — — 361 361
Unrealized losses on cash flow hedging
derivatives — — — — — — (7,268)(7,268)
Reclassification adjustment for gains on
available-for-sale securities included in net
income — — — — — — (338)(338)
Reclassification adjustment for losses on cash
flow hedging derivatives included in net income — — — — — — 17,170 17,170
BALANCE, December 31, 2010 355,318,666 $ 36 237,818 $ (1,914) $ 1,686,761 $ 858,108 $ (1,415) $ 2,541,576
Exercise of Common Stock options 6,370,790 — — — 59,077 — — 59,077
Restricted Common Stock vested and issued 1,136,002 — — — — — — —
Stock-based compensation expense — — — — 41,791 — — 41,791
Tax impact of Common Stock option and
restricted stock forfeitures — — — — (3,356) — — (3,356)
Purchase of Treasury Stock (365,063) — 365,063 (4,918) — — — (4,918)
Net income — — — — — 301,310 — 301,310
Unrealized gains on available-for-sale securities — — — — — — 212 212
Unrealized losses on cash flow hedging
derivatives — — — — — — (22,145)(22,145)
Reclassification adjustment for gains on
available-for-sale securities included in net
income — — — — — — (303)(303)
Reclassification adjustment for losses on cash
flow hedging derivatives included in net income — — — — — — 14,356 14,356
BALANCE, December 31, 2011 362,460,395 $ 36 602,881 $ (6,832) $ 1,784,273 $ 1,159,418 $ (9,295) $ 2,927,600
The accompanying notes are an integral part of these consolidated financial statements.