Metro PCS 2011 Annual Report Download - page 143
Download and view the complete annual report
Please find page 143 of the 2011 Metro PCS annual report below. You can navigate through the pages in the report by either clicking on the pages listed below, or by using the keyword search tool below to find specific information within the annual report.-
 1
1 -
2
-
3
-
4
-
5
-
6
-
7
-
8
-
9
-
10
-
11
-
12
-
13
-
14
-
15
-
16
-
17
-
18
-
19
-
20
-
21
-
22
-
23
-
24
-
25
-
26
-
27
-
28
-
29
-
30
-
31
-
32
-
33
-
34
-
35
-
36
-
37
-
38
-
39
-
40
-
41
-
42
-
43
-
44
-
45
-
46
-
47
-
48
-
49
-
50
-
51
-
52
-
53
-
54
-
55
-
56
-
57
-
58
-
59
-
60
-
61
-
62
-
63
-
64
-
65
-
66
-
67
-
68
-
69
-
70
-
71
-
72
-
73
-
74
-
75
-
76
-
77
-
78
-
79
-
80
-
81
-
82
-
83
-
84
-
85
-
86
-
87
-
88
-
89
-
90
-
91
-
92
-
93
-
94
-
95
-
96
-
97
-
98
-
99
-
100
-
101
-
102
-
103
-
104
-
105
-
106
-
107
-
108
-
109
-
110
-
111
-
112
-
113
-
114
-
115
-
116
-
117
-
118
-
119
-
120
-
121
-
122
-
123
-
124
-
125
-
126
-
127
-
128
-
129
-
130
-
131
-
132
-
 133
133 -
 134
134 -
 135
135 -
 136
136 -
 137
137 -
 138
138 -
 139
139 -
 140
140 -
 141
141 -
 142
142 -
 143
143 -
 144
144 -
 145
145 -
 146
146 -
 147
147 -
 148
148
 |
 |

MetroPCS Communications, Inc. and Subsidiaries
Notes to Consolidated Financial Statements
December 31, 2011, 2010 and 2009
F-37
Year Ended December 31,
2011 2010 2009
Capital lease payments included in financing activities $ 6.9 $ 2.9 $ 2.8
One of the Company's current directors is an officer of a company whose wholly-owned subsidiaries provide rating and
market research services to the Company. The Company paid approximately $0.4 million, $1.0 million and $0.4 million to
these companies for these services during the years ended December 31, 2011, 2010 and 2009, respectively. The majority of
these costs were associated with the issuance of long-term debt and were capitalized as deferred debt issuance costs within
other assets in the accompanying consolidated balance sheets. The costs are being amortized to interest expense over the life of
the related debt.
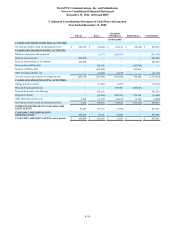
18. Supplemental Cash Flow Information:
Year Ended December 31,
2011 2010 2009
(in thousands)
Cash paid for interest $ 247,702 $ 255,960 $ 248,800
Cash paid for income taxes 4,521 2,857 3,085
Non-cash investing and financing activities
The Company’s accrued purchases of property and equipment were $90.9 million, $102.6 million and $21.4 million as of
December 31, 2011, 2010 and 2009, respectively. Included within the Company’s accrued purchases are estimates by
management for construction services received based on a percentage of completion.
Assets acquired under capital lease obligations were $33.4 million, $76.6 million and $92.2 million for the years ended
December 31, 2011, 2010 and 2009, respectively.
During the years ended December 31, 2011, 2010 and 2009, the Company returned obsolete network infrastructure assets
to one of its vendors in exchange for $6.4 million, $24.4 million and $17.4 million in credits towards the purchase of additional
network infrastructure assets with the vendor.
During the years ended December 31, 2010 and 2009, the Company received $53.4 million and $52.3 million in fair value
of FCC licenses in exchanges with other parties.
The Company's accrued assets acquired in asset acquisitions were $8.0 million as of December 31, 2010.
See Note 2 for the non-cash changes in the Company's asset retirement obligations.
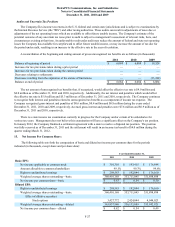
19. Quarterly Financial Data (Unaudited):
The following financial information reflects all normal recurring adjustments that are, in the opinion of management,
necessary for a fair statement of the Company's results of operations for the interim periods. Summarized data for each interim
period for the years ended December 31, 2011 and 2010 is as follows (in thousands, except per share data):
Three Months Ended
March 31,
2011 June 30,
2011 September 30,
2011 December 31,
2011
Total revenues $ 1,194,377 $ 1,209,453 $ 1,205,388 $ 1,238,164
Income from operations 145,337 210,255 176,831 215,115
Net income 56,378 84,335 69,326 91,271
Net income per common share - basic $ 0.16 $ 0.23 $ 0.19 $ 0.25
Net income per common share - diluted $ 0.15 $ 0.23 $ 0.19 $ 0.25