Metro PCS 2011 Annual Report Download - page 73
Download and view the complete annual report
Please find page 73 of the 2011 Metro PCS annual report below. You can navigate through the pages in the report by either clicking on the pages listed below, or by using the keyword search tool below to find specific information within the annual report.-
 1
1 -
2
-
3
-
4
-
5
-
6
-
7
-
8
-
9
-
10
-
11
-
12
-
13
-
14
-
15
-
16
-
17
-
18
-
19
-
20
-
21
-
22
-
23
-
24
-
25
-
26
-
27
-
28
-
29
-
30
-
31
-
32
-
33
-
34
-
35
-
36
-
37
-
38
-
39
-
40
-
41
-
42
-
43
-
44
-
45
-
46
-
47
-
48
-
49
-
50
-
51
-
52
-
53
-
54
-
55
-
56
-
57
-
58
-
59
-
60
-
61
-
62
-
 63
63 -
 64
64 -
 65
65 -
 66
66 -
 67
67 -
 68
68 -
 69
69 -
 70
70 -
 71
71 -
 72
72 -
 73
73 -
 74
74 -
 75
75 -
 76
76 -
 77
77 -
 78
78 -
 79
79 -
 80
80 -
 81
81 -
 82
82 -
 83
83 -
84
-
85
-
86
-
87
-
88
-
89
-
90
-
91
-
92
-
93
-
94
-
95
-
96
-
97
-
98
-
99
-
100
-
101
-
102
-
103
-
104
-
105
-
106
-
107
-
108
-
109
-
110
-
111
-
112
-
113
-
114
-
115
-
116
-
117
-
118
-
119
-
120
-
121
-
122
-
123
-
124
-
125
-
126
-
127
-
128
-
129
-
130
-
131
-
132
-
133
-
134
-
135
-
136
-
137
-
138
-
139
-
140
-
141
-
142
-
143
-
144
-
145
-
146
-
147
-
148
 |
 |

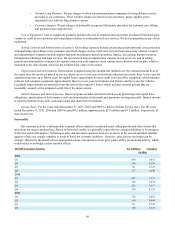
62
As of December 31,
2011 2010 2009 2008 2007
(In Thousands)
Balance Sheet Data:
Cash, cash equivalents & short-term investments $ 2,243,254 $ 1,171,393 $ 1,154,313 $ 697,951 $ 1,470,208
Property and equipment, net 4,017,999 3,659,445 3,252,213 2,847,751 1,891,411
Total assets 9,482,931 7,918,580 7,386,017 6,422,148 5,806,130
Long-term debt (including current maturities) 4,744,481 3,779,283 3,645,275 3,074,992 3,002,177
Stockholders' equity 2,927,600 2,541,576 2,288,142 2,034,323 1,848,746
———————————
(1) See Note 15 to the consolidated financial statements included elsewhere in this report for an explanation of the calculation of basic and diluted net income per common share.
The calculation of basic and diluted net income per common share for the year ended December 31, 2007 and 2008 is not included in Note 15 to the consolidated financial
statements.