Metro PCS 2011 Annual Report Download - page 137
Download and view the complete annual report
Please find page 137 of the 2011 Metro PCS annual report below. You can navigate through the pages in the report by either clicking on the pages listed below, or by using the keyword search tool below to find specific information within the annual report.-
 1
1 -
2
-
3
-
4
-
5
-
6
-
7
-
8
-
9
-
10
-
11
-
12
-
13
-
14
-
15
-
16
-
17
-
18
-
19
-
20
-
21
-
22
-
23
-
24
-
25
-
26
-
27
-
28
-
29
-
30
-
31
-
32
-
33
-
34
-
35
-
36
-
37
-
38
-
39
-
40
-
41
-
42
-
43
-
44
-
45
-
46
-
47
-
48
-
49
-
50
-
51
-
52
-
53
-
54
-
55
-
56
-
57
-
58
-
59
-
60
-
61
-
62
-
63
-
64
-
65
-
66
-
67
-
68
-
69
-
70
-
71
-
72
-
73
-
74
-
75
-
76
-
77
-
78
-
79
-
80
-
81
-
82
-
83
-
84
-
85
-
86
-
87
-
88
-
89
-
90
-
91
-
92
-
93
-
94
-
95
-
96
-
97
-
98
-
99
-
100
-
101
-
102
-
103
-
104
-
105
-
106
-
107
-
108
-
109
-
110
-
111
-
112
-
113
-
114
-
115
-
116
-
117
-
118
-
119
-
120
-
121
-
122
-
123
-
124
-
125
-
126
-
 127
127 -
 128
128 -
 129
129 -
 130
130 -
 131
131 -
 132
132 -
 133
133 -
 134
134 -
 135
135 -
 136
136 -
 137
137 -
 138
138 -
 139
139 -
 140
140 -
 141
141 -
 142
142 -
 143
143 -
 144
144 -
 145
145 -
 146
146 -
 147
147 -
148
 |
 |

MetroPCS Communications, Inc. and Subsidiaries
Notes to Consolidated Financial Statements
December 31, 2011, 2010 and 2009
F-31
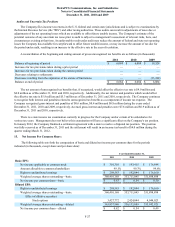
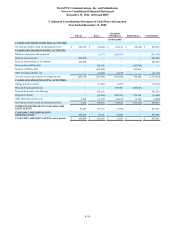
Condensed Consolidating Statement of Income Information
Year Ended December 31, 2011
Parent Issuer Guarantor
Subsidiaries Eliminations Consolidated
(in thousands)
REVENUES:
Total Revenues $ — $ 18,802 $ 4,858,650 $ (30,070) $ 4,847,382
OPERATING EXPENSES:
Cost of revenues — 17,452 2,926,049 (30,070) 2,913,431
Selling, general and administrative expenses — 1,350 642,609 — 643,959
Other operating expenses — 264 542,190 — 542,454
Total operating expenses — 19,066 4,110,848 (30,070) 4,099,844
(Loss) income from operations — (264) 747,802 — 747,538
OTHER EXPENSE (INCOME):
Interest expense — 243,163 17,910 — 261,073
Non-operating expenses (1,859) 9,414 (746) — 6,809
Earnings from consolidated subsidiaries (299,451) (734,432) — 1,033,883 —
Total other (income) expense (301,310) (481,855) 17,164 1,033,883 267,882
Income (loss) before provision for income taxes 301,310 481,591 730,638 (1,033,883) 479,656
Provision for income taxes — (182,140) 3,794 — (178,346)
Net income (loss) $ 301,310 $ 299,451 $ 734,432 $ (1,033,883) $ 301,310
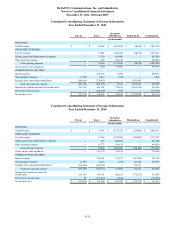
Condensed Consolidating Statement of Income Information
Year Ended December 31, 2010
Parent Issuer Guarantor
Subsidiaries Eliminations Consolidated
(in thousands)
REVENUES:
Total Revenues $ — $ 16,036 $ 4,277,726 $ (224,409) $ 4,069,353
OPERATING EXPENSES:
Cost of revenues — 15,200 2,527,084 (224,409) 2,317,875
Selling, general and administrative expenses — 835 620,825 — 621,660
Other operating expenses — 16,773 394,147 — 410,920
Total operating expenses — 32,808 3,542,056 (224,409) 3,350,455
(Loss) income from operations — (16,772) 735,670 — 718,898
OTHER EXPENSE (INCOME):
Interest expense — 252,661 153,672 (143,208) 263,125
Non-operating expenses (1,797) 2,233 (165) 143,208 143,479
Earnings from consolidated subsidiaries (191,546) (581,027) — 772,573 —
Total other (income) expense (193,343) (326,133) 153,507 772,573 406,604
Income (loss) before provision for
income taxes 193,343 309,361 582,163 (772,573) 312,294
Provision for income taxes 72 (117,815) (1,136) — (118,879)
Net income (loss) $ 193,415 $ 191,546 $ 581,027 $ (772,573) $ 193,415