Metro PCS 2011 Annual Report Download - page 125
Download and view the complete annual report
Please find page 125 of the 2011 Metro PCS annual report below. You can navigate through the pages in the report by either clicking on the pages listed below, or by using the keyword search tool below to find specific information within the annual report.-
 1
1 -
2
-
3
-
4
-
5
-
6
-
7
-
8
-
9
-
10
-
11
-
12
-
13
-
14
-
15
-
16
-
17
-
18
-
19
-
20
-
21
-
22
-
23
-
24
-
25
-
26
-
27
-
28
-
29
-
30
-
31
-
32
-
33
-
34
-
35
-
36
-
37
-
38
-
39
-
40
-
41
-
42
-
43
-
44
-
45
-
46
-
47
-
48
-
49
-
50
-
51
-
52
-
53
-
54
-
55
-
56
-
57
-
58
-
59
-
60
-
61
-
62
-
63
-
64
-
65
-
66
-
67
-
68
-
69
-
70
-
71
-
72
-
73
-
74
-
75
-
76
-
77
-
78
-
79
-
80
-
81
-
82
-
83
-
84
-
85
-
86
-
87
-
88
-
89
-
90
-
91
-
92
-
93
-
94
-
95
-
96
-
97
-
98
-
99
-
100
-
101
-
102
-
103
-
104
-
105
-
106
-
107
-
108
-
109
-
110
-
111
-
112
-
113
-
114
-
 115
115 -
 116
116 -
 117
117 -
 118
118 -
 119
119 -
 120
120 -
 121
121 -
 122
122 -
 123
123 -
 124
124 -
 125
125 -
 126
126 -
 127
127 -
 128
128 -
 129
129 -
 130
130 -
 131
131 -
 132
132 -
 133
133 -
 134
134 -
 135
135 -
136
-
137
-
138
-
139
-
140
-
141
-
142
-
143
-
144
-
145
-
146
-
147
-
148
 |
 |

MetroPCS Communications, Inc. and Subsidiaries
Notes to Consolidated Financial Statements
December 31, 2011, 2010 and 2009
F-19
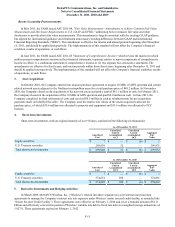
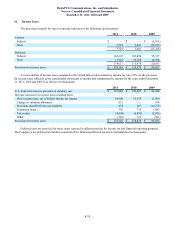
investment portfolio is subject to uncertainties that are difficult to predict. Factors that may impact the Company’s valuation
include changes to credit ratings of the securities as well as the underlying assets supporting those securities, rates of default of
the underlying assets, underlying collateral values, discount rates, counterparty risk and ongoing strength and quality of market
credit and liquidity. Significant inputs to the investments valuation are unobservable in the active markets and are classified as
Level 3 in the hierarchy.
Included in the Company’s derivative financial instruments are interest rate swaps. Derivative financial instruments are
valued in the market using discounted cash flow techniques. These techniques incorporate Level 1 and Level 2 inputs such as
interest rates. These market inputs are utilized in the discounted cash flow calculation considering the instrument’s term,
notional amount, discount rate and credit risk. Significant inputs to the derivative valuation for interest rate swaps are
observable in the active markets and are classified as Level 2 in the hierarchy.
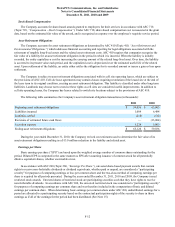
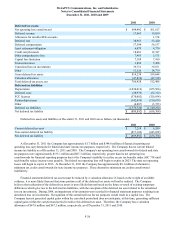
The following table summarizes assets and liabilities measured at fair value on a recurring basis at December 31, 2011, as
required by ASC 820 (in thousands):
Fair Value Measurements
Level 1 Level 2 Level 3 Total
Assets
Cash equivalents $ 1,815,538 $ — $ — $ 1,815,538
Short-term investments 299,972 — — 299,972
Restricted cash and investments 2,576 — — 2,576
Long-term investments — — 6,319 6,319
Total assets measured at fair value $ 2,118,086 $ — $ 6,319 $ 2,124,405
Liabilities
Derivative liabilities $ — $ 21,015 $ — $ 21,015
Total liabilities measured at fair value $ — $ 21,015 $ — $ 21,015
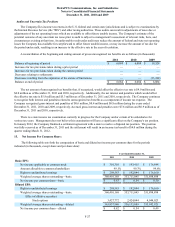
The following table summarizes assets and liabilities measured at fair value on a recurring basis at December 31, 2010, as
required by ASC 820 (in thousands):
Fair Value Measurements
Level 1 Level 2 Level 3 Total
Assets
Cash equivalents $ 787,829 $ — $ — $ 787,829
Short-term investments 374,862 — — 374,862
Restricted cash and investments 2,876 — — 2,876
Long-term investments — — 6,319 6,319
Derivative assets — 10,381 — 10,381
Total assets measured at fair value $ 1,165,567 $ 10,381 $ 6,319 $ 1,182,267
Liabilities
Derivative liabilities $ — $ 18,690 $ — $ 18,690
Total liabilities measured at fair value $ — $ 18,690 $ — $ 18,690