Metro PCS 2011 Annual Report Download - page 139
Download and view the complete annual report
Please find page 139 of the 2011 Metro PCS annual report below. You can navigate through the pages in the report by either clicking on the pages listed below, or by using the keyword search tool below to find specific information within the annual report.-
 1
1 -
2
-
3
-
4
-
5
-
6
-
7
-
8
-
9
-
10
-
11
-
12
-
13
-
14
-
15
-
16
-
17
-
18
-
19
-
20
-
21
-
22
-
23
-
24
-
25
-
26
-
27
-
28
-
29
-
30
-
31
-
32
-
33
-
34
-
35
-
36
-
37
-
38
-
39
-
40
-
41
-
42
-
43
-
44
-
45
-
46
-
47
-
48
-
49
-
50
-
51
-
52
-
53
-
54
-
55
-
56
-
57
-
58
-
59
-
60
-
61
-
62
-
63
-
64
-
65
-
66
-
67
-
68
-
69
-
70
-
71
-
72
-
73
-
74
-
75
-
76
-
77
-
78
-
79
-
80
-
81
-
82
-
83
-
84
-
85
-
86
-
87
-
88
-
89
-
90
-
91
-
92
-
93
-
94
-
95
-
96
-
97
-
98
-
99
-
100
-
101
-
102
-
103
-
104
-
105
-
106
-
107
-
108
-
109
-
110
-
111
-
112
-
113
-
114
-
115
-
116
-
117
-
118
-
119
-
120
-
121
-
122
-
123
-
124
-
125
-
126
-
127
-
128
-
 129
129 -
 130
130 -
 131
131 -
 132
132 -
 133
133 -
 134
134 -
 135
135 -
 136
136 -
 137
137 -
 138
138 -
 139
139 -
 140
140 -
 141
141 -
 142
142 -
 143
143 -
 144
144 -
 145
145 -
 146
146 -
 147
147 -
 148
148
 |
 |

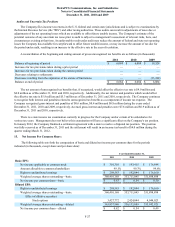
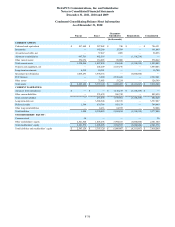
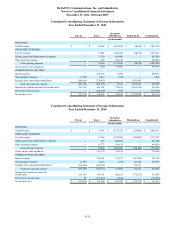
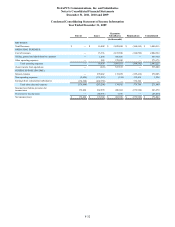
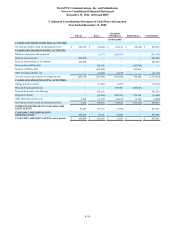
MetroPCS Communications, Inc. and Subsidiaries
Notes to Consolidated Financial Statements
December 31, 2011, 2010 and 2009
F-33
Condensed Consolidating Statement of Cash Flows Information
Year Ended December 31, 2011
Parent Issuer Guarantor
Subsidiaries Eliminations Consolidated
(in thousands)
CASH FLOWS FROM OPERATING ACTIVITIES:
Net cash provided by (used in) operating activities $ 1,363 $ (331,843) $ 1,392,288 $ — $ 1,061,808
CASH FLOWS FROM INVESTING ACTIVITIES:
Purchases of property and equipment — (5,944) (883,825) — (889,769)
Purchase of investments (599,765) — — — (599,765)
Proceeds from maturity of investments 675,000 — — — 675,000
Change in advances – affiliates 18,683 471,116 — (489,799) —
Other investing activities, net — (61,515) (10,822) — (72,337)
Net cash provided by (used in) investing activities 93,918 403,657 (894,647) (489,799) (886,871)
CASH FLOWS FROM FINANCING ACTIVITIES:
Change in advances – affiliates — — (489,799) 489,799 —
Change in book overdraft — 3,445 — — 3,445
Proceeds from debt issuance, net of discount — 1,497,500 — — 1,497,500
Retirement of long-term debt — (535,792) — — (535,792)
Repayment of debt — (24,292) — — (24,292)
Other financing activities, net 54,159 (15,351) (7,855) — 30,953
Net cash provided by (used in) financing activities 54,159 925,510 (497,654) 489,799 971,814
INCREASE (DECREASE) IN CASH AND CASH
EQUIVALENTS 149,440 997,324 (13) — 1,146,751
CASH AND CASH EQUIVALENTS, beginning of
period 507,849 287,942 740 — 796,531
CASH AND CASH EQUIVALENTS, end of period $ 657,289 $ 1,285,266 $ 727 $ — $ 1,943,282