Metro PCS 2011 Annual Report Download - page 92
Download and view the complete annual report
Please find page 92 of the 2011 Metro PCS annual report below. You can navigate through the pages in the report by either clicking on the pages listed below, or by using the keyword search tool below to find specific information within the annual report.-
 1
1 -
2
-
3
-
4
-
5
-
6
-
7
-
8
-
9
-
10
-
11
-
12
-
13
-
14
-
15
-
16
-
17
-
18
-
19
-
20
-
21
-
22
-
23
-
24
-
25
-
26
-
27
-
28
-
29
-
30
-
31
-
32
-
33
-
34
-
35
-
36
-
37
-
38
-
39
-
40
-
41
-
42
-
43
-
44
-
45
-
46
-
47
-
48
-
49
-
50
-
51
-
52
-
53
-
54
-
55
-
56
-
57
-
58
-
59
-
60
-
61
-
62
-
63
-
64
-
65
-
66
-
67
-
68
-
69
-
70
-
71
-
72
-
73
-
74
-
75
-
76
-
77
-
78
-
79
-
80
-
81
-
 82
82 -
 83
83 -
 84
84 -
 85
85 -
 86
86 -
 87
87 -
 88
88 -
 89
89 -
 90
90 -
 91
91 -
 92
92 -
 93
93 -
 94
94 -
 95
95 -
 96
96 -
 97
97 -
 98
98 -
 99
99 -
 100
100 -
 101
101 -
 102
102 -
103
-
104
-
105
-
106
-
107
-
108
-
109
-
110
-
111
-
112
-
113
-
114
-
115
-
116
-
117
-
118
-
119
-
120
-
121
-
122
-
123
-
124
-
125
-
126
-
127
-
128
-
129
-
130
-
131
-
132
-
133
-
134
-
135
-
136
-
137
-
138
-
139
-
140
-
141
-
142
-
143
-
144
-
145
-
146
-
147
-
148
 |
 |

81
Three Months Ended
March 31,
2010 June 30,
2010 September 30,
2010 December 31,
2010
(in thousands)
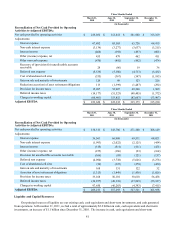
Reconciliation of Net Cash Provided by Operating
Activities to Adjusted EBITDA:
Net cash provided by operating activities $ 225,032 $ 112,418 $ 341,940 $ 315,109
Adjustments:
Interest expense 67,482 65,503 65,726 64,415
Non-cash interest expense (3,134)(3,277)(3,637)(3,215)
Interest income (464)(392)(497)(601)
Other (income) expense, net 455 479 462 411
Other non-cash expense (470)(492)(492)(474)
Recovery of (provision for) uncollectible accounts
receivable 28 (86) 19 36
Deferred rent expense (5,535)(5,380)(4,733)(5,432)
Cost of abandoned cell sites (535)(367)(547)(1,183)
Gain on sale and maturity of investments 129 89 123 226
Reduction (accretion) of asset retirement obligations 113 (1,399)(1,487)(292)
Provision for income taxes 15,097 52,907 49,366 1,509
Deferred income taxes (14,177)(51,523)(48,405)(1,372)
Changes in working capital (60,401) 153,852 (82,663)(53,907)
Adjusted EBITDA $ 223,620 $ 322,332 $ 315,175 $ 315,230
Three Months Ended
March 31,
2011 June 30,
2011 September 30,
2011 December 31,
2011
(in thousands)
Reconciliation of Net Cash Provided by Operating
Activities to Adjusted EBITDA:
Net cash provided by operating activities $ 138,313 $ 343,786 $ 271,560 $ 308,149
Adjustments:
Interest expense 56,561 66,980 69,511 68,021
Non-cash interest expense (1,993)(2,022)(2,125)(454)
Interest income (515)(511)(531)(471)
Other (income) expense, net (255)(186)(93)(164)
Provision for uncollectible accounts receivable (166)(95)(121)(137)
Deferred rent expense (4,094)(3,738)(5,626)(5,278)
Cost of abandoned cell sites (56)(323)(270)(450)
Gain on sale and maturity of investments 168 151 122 52
Accretion of asset retirement obligations (1,313)(1,449)(1,436)(1,026)
Provision for income taxes 33,168 50,101 38,618 56,458
Deferred income taxes (32,257)(49,138)(37,895)(55,327)
Changes in working capital 97,650 (46,263)(4,393)(7,415)
Adjusted EBITDA $ 285,211 $ 357,293 $ 327,321 $ 361,958
Liquidity and Capital Resources
Our principal sources of liquidity are our existing cash, cash equivalents and short-term investments, and cash generated
from operations. At December 31, 2011, we had a total of approximately $2.2 billion in cash, cash equivalents and short-term
investments, an increase of $1.1 billion since December 31, 2010. The increase in cash, cash equivalents and short-term