Metro PCS 2011 Annual Report Download - page 88
Download and view the complete annual report
Please find page 88 of the 2011 Metro PCS annual report below. You can navigate through the pages in the report by either clicking on the pages listed below, or by using the keyword search tool below to find specific information within the annual report.-
 1
1 -
2
-
3
-
4
-
5
-
6
-
7
-
8
-
9
-
10
-
11
-
12
-
13
-
14
-
15
-
16
-
17
-
18
-
19
-
20
-
21
-
22
-
23
-
24
-
25
-
26
-
27
-
28
-
29
-
30
-
31
-
32
-
33
-
34
-
35
-
36
-
37
-
38
-
39
-
40
-
41
-
42
-
43
-
44
-
45
-
46
-
47
-
48
-
49
-
50
-
51
-
52
-
53
-
54
-
55
-
56
-
57
-
58
-
59
-
60
-
61
-
62
-
63
-
64
-
65
-
66
-
67
-
68
-
69
-
70
-
71
-
72
-
73
-
74
-
75
-
76
-
77
-
 78
78 -
 79
79 -
 80
80 -
 81
81 -
 82
82 -
 83
83 -
 84
84 -
 85
85 -
 86
86 -
 87
87 -
 88
88 -
 89
89 -
 90
90 -
 91
91 -
 92
92 -
 93
93 -
 94
94 -
 95
95 -
 96
96 -
 97
97 -
 98
98 -
99
-
100
-
101
-
102
-
103
-
104
-
105
-
106
-
107
-
108
-
109
-
110
-
111
-
112
-
113
-
114
-
115
-
116
-
117
-
118
-
119
-
120
-
121
-
122
-
123
-
124
-
125
-
126
-
127
-
128
-
129
-
130
-
131
-
132
-
133
-
134
-
135
-
136
-
137
-
138
-
139
-
140
-
141
-
142
-
143
-
144
-
145
-
146
-
147
-
148
 |
 |
77
Year Ended December 31,
2011 2010 2009
(in thousands, except gross customer additions and
CPGA)
Calculation of Cost Per Gross Addition (CPGA):
Selling expenses $ 342,019 $ 330,593 $ 302,275
Less: Equipment revenues (419,174)(379,658)(350,130)
Add: Impact to service revenues of promotional activity — 778 42,931
Add: Equipment revenue not associated with new customers 261,271 225,115 169,929
Add: Cost of equipment 1,439,595 1,093,944 884,272
Less: Equipment costs not associated with new customers (704,257)(520,972)(275,793)
Gross addition expenses $ 919,454 $ 749,800 $ 773,484
Divided by: Gross customer additions 5,311,276 4,768,011 5,305,505
CPGA $ 173.11 $ 157.26 $ 145.79
Three Months Ended
March 31,
2010 June 30,
2010 September 30,
2010 December 31,
2010
(in thousands, except gross customer additions and CPGA)
Calculation of Cost Per Gross Addition (CPGA):
Selling expenses $ 89,146 $ 86,194 $ 73,380 $ 81,872
Less: Equipment revenues (117,220)(90,399)(78,538)(93,502)
Add: Impact to service revenues of promotional
activity 778 — — —
Add: Equipment revenue not associated with new
customers 63,313 54,392 54,201 53,210
Add: Cost of equipment 313,738 235,354 256,265 288,587
Less: Equipment costs not associated with new
customers (134,744)(113,377)(128,016)(144,834)
Gross addition expenses $ 215,011 $ 172,164 $ 177,292 $ 185,333
Divided by: Gross customer additions 1,470,865 1,047,898 1,104,350 1,144,898
CPGA $ 146.18 $ 164.29 $ 160.54 $ 161.88
Three Months Ended
March 31,
2011 June 30,
2011 September 30,
2011 December 31,
2011
(in thousands, except gross customer additions and CPGA)
Calculation of Cost Per Gross Addition (CPGA):
Selling expenses $ 91,863 $ 78,522 $ 88,702 $ 82,933
Less: Equipment revenues (144,160)(96,161)(74,334)(104,519)
Add: Equipment revenue not associated with new
customers 75,234 59,355 58,026 68,655
Add: Cost of equipment 409,262 342,534 343,473 344,326
Less: Equipment costs not associated with new
customers (192,202)(159,931)(163,610)(188,514)
Gross addition expenses $ 239,997 $ 224,319 $ 252,257 $ 202,881
Divided by: Gross customer additions 1,525,880 1,261,091 1,300,611 1,223,694
CPGA $ 157.28 $ 177.88 $ 193.95 $ 165.79
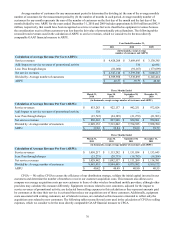
CPU — We utilize CPU as a tool to evaluate the non-selling cash expenses associated with ongoing business operations
on a per customer basis, to track changes in these non-selling cash costs over time, and to help evaluate how changes in our
business operations affect non-selling cash costs per customer. In addition, CPU provides management with a useful measure to
compare our non-selling cash costs per customer with those of other wireless broadband mobile providers. We believe investors