Metro PCS 2011 Annual Report Download - page 136
Download and view the complete annual report
Please find page 136 of the 2011 Metro PCS annual report below. You can navigate through the pages in the report by either clicking on the pages listed below, or by using the keyword search tool below to find specific information within the annual report.
MetroPCS Communications, Inc. and Subsidiaries
Notes to Consolidated Financial Statements
December 31, 2011, 2010 and 2009
F-30
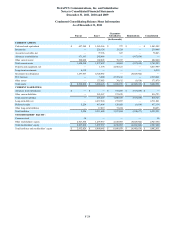
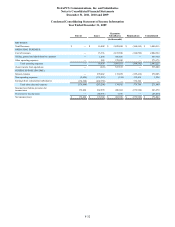
Condensed Consolidating Balance Sheet Information
As of December 31, 2010
Parent Issuer Guarantor
Subsidiaries Eliminations Consolidated
(in thousands)
CURRENT ASSETS:
Cash and cash equivalents $ 507,849 $ 287,942 $ 740 $ — $ 796,531
Inventories — 145,260 15,789 — 161,049
Accounts receivable, net — 57,047 1,009 — 58,056
Advances to subsidiaries 647,701 462,518 — (1,110,219) —
Other current assets 374,956 114,285 89,008 — 578,249
Total current assets 1,530,506 1,067,052 106,546 (1,110,219) 1,593,885
Property and equipment, net — 246,249 3,413,196 — 3,659,445
Long-term investments 6,319 10,381 — — 16,700
Investment in subsidiaries 1,006,295 3,994,553 — (5,000,848) —
FCC licenses — 3,800 2,518,441 — 2,522,241
Other assets — 75,085 51,224 — 126,309
Total assets $ 2,543,120 $ 5,397,120 $ 6,089,407 $ (6,111,067) $ 7,918,580
CURRENT LIABILITIES:
Advances from subsidiaries $ — $ — $ 1,110,219 $ (1,110,219) $ —
Other current liabilities — 233,678 568,742 — 802,420
Total current liabilities — 233,678 1,678,961 (1,110,219) 802,420
Long-term debt, net — 3,508,948 248,339 — 3,757,287
Deferred credits 1,544 639,766 103,159 — 744,469
Other long-term liabilities — 8,433 64,395 — 72,828
Total liabilities 1,544 4,390,825 2,094,854 (1,110,219) 5,377,004
STOCKHOLDERS’ EQUITY:
Common stock 36 — — — 36
Other stockholders’ equity 2,541,540 1,006,295 3,994,553 (5,000,848) 2,541,540
Total stockholders’ equity 2,541,576 1,006,295 3,994,553 (5,000,848) 2,541,576
Total liabilities and stockholders’ equity $ 2,543,120 $ 5,397,120 $ 6,089,407 $ (6,111,067) $ 7,918,580


