Metro PCS 2011 Annual Report Download - page 87
Download and view the complete annual report
Please find page 87 of the 2011 Metro PCS annual report below. You can navigate through the pages in the report by either clicking on the pages listed below, or by using the keyword search tool below to find specific information within the annual report.-
 1
1 -
2
-
3
-
4
-
5
-
6
-
7
-
8
-
9
-
10
-
11
-
12
-
13
-
14
-
15
-
16
-
17
-
18
-
19
-
20
-
21
-
22
-
23
-
24
-
25
-
26
-
27
-
28
-
29
-
30
-
31
-
32
-
33
-
34
-
35
-
36
-
37
-
38
-
39
-
40
-
41
-
42
-
43
-
44
-
45
-
46
-
47
-
48
-
49
-
50
-
51
-
52
-
53
-
54
-
55
-
56
-
57
-
58
-
59
-
60
-
61
-
62
-
63
-
64
-
65
-
66
-
67
-
68
-
69
-
70
-
71
-
72
-
73
-
74
-
75
-
76
-
 77
77 -
 78
78 -
 79
79 -
 80
80 -
 81
81 -
 82
82 -
 83
83 -
 84
84 -
 85
85 -
 86
86 -
 87
87 -
 88
88 -
 89
89 -
 90
90 -
 91
91 -
 92
92 -
 93
93 -
 94
94 -
 95
95 -
 96
96 -
 97
97 -
98
-
99
-
100
-
101
-
102
-
103
-
104
-
105
-
106
-
107
-
108
-
109
-
110
-
111
-
112
-
113
-
114
-
115
-
116
-
117
-
118
-
119
-
120
-
121
-
122
-
123
-
124
-
125
-
126
-
127
-
128
-
129
-
130
-
131
-
132
-
133
-
134
-
135
-
136
-
137
-
138
-
139
-
140
-
141
-
142
-
143
-
144
-
145
-
146
-
147
-
148
 |
 |

76
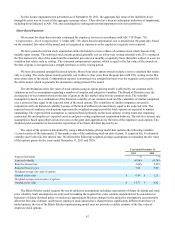
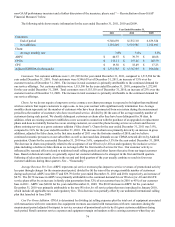
Average number of customers for any measurement period is determined by dividing (a) the sum of the average monthly
number of customers for the measurement period by (b) the number of months in such period. Average monthly number of
customers for any month represents the sum of the number of customers on the first day of the month and the last day of the
month divided by two. ARPU for the years ended December 31, 2010 and 2009 includes approximately $0.8 million and $42.9
million, respectively, that would have been recognized as service revenues but were classified as equipment revenues because
the consideration received from customers was less than the fair value of promotionally priced handsets. The following tables
reconcile total revenues used in the calculation of ARPU to service revenues, which we consider to be the most directly
comparable GAAP financial measure to ARPU.
Year Ended December 31,
2011 2010 2009
(in thousands, except average
number of customers and ARPU)
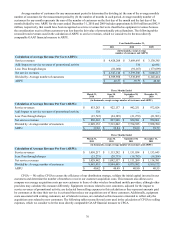
Calculation of Average Revenue Per User (ARPU):
Service revenues $ 4,428,208 $ 3,689,695 $ 3,130,385
Add: Impact to service revenues of promotional activity — 778 42,931
Less: Pass through charges (81,060)(91,167)(173,099)
Net service revenues $ 4,347,148 $ 3,599,306 $ 3,000,217
Divided by: Average number of customers 8,929,898 7,538,895 6,145,414
ARPU $ 40.57 $ 39.79 $ 40.68
Three Months Ended
March 31,
2010 June 30,
2010 September 30,
2010 December 31,
2010
(in thousands, except average number of customers and ARPU)
Calculation of Average Revenue Per User (ARPU):
Service revenues $ 853,283 $ 922,137 $ 942,251 $ 972,024
Add: Impact to service revenues of promotional activity 778 — — —
Less: Pass through charges (23,745)(24,189)(21,270)(21,963)
Net service revenues $ 830,316 $ 897,948 $ 920,981 $ 950,061
Divided by: Average number of customers 6,949,153 7,513,202 7,734,525 7,958,700
ARPU $ 39.83 $ 39.84 $ 39.69 $ 39.79
Three Months Ended
March 31,
2011 June 30,
2011 September 30,
2011 December 31,
2011
(in thousands, except average number of customers and ARPU)
Calculation of Average Revenue Per User (ARPU):
Service revenues $ 1,050,217 $ 1,113,292 $ 1,131,054 $ 1,133,645
Less: Pass through charges (21,275)(20,735)(19,785)(19,264)
Net service revenues $ 1,028,942 $ 1,092,557 $ 1,111,269 $ 1,114,381
Divided by: Average number of customers 8,485,035 8,994,405 9,079,982 9,160,172
ARPU $ 40.42 $ 40.49 $ 40.80 $ 40.55
CPGA — We utilize CPGA to assess the efficiency of our distribution strategy, validate the initial capital invested in our
customers and determine the number of months to recover our customer acquisition costs. This measure also allows us to
compare our average acquisition costs per new customer to those of other wireless broadband mobile providers, although other
providers may calculate this measure differently. Equipment revenues related to new customers, adjusted for the impact to
service revenues of promotional activity, are deducted from selling expenses in this calculation as they represent amounts paid
by customers at the time their service is activated that reduce our acquisition cost of those customers. Additionally, equipment
costs associated with existing customers, net of related revenues, are excluded as this measure is intended to reflect only the
acquisition costs related to new customers. The following tables reconcile total costs used in the calculation of CPGA to selling
expenses, which we consider to be the most directly comparable GAAP financial measure to CPGA.