Lexmark 2009 Annual Report Download - page 93
Download and view the complete annual report
Please find page 93 of the 2009 Lexmark annual report below. You can navigate through the pages in the report by either clicking on the pages listed below, or by using the keyword search tool below to find specific information within the annual report.-
 1
1 -
2
-
3
-
4
-
5
-
6
-
7
-
8
-
9
-
10
-
11
-
12
-
13
-
14
-
15
-
16
-
17
-
18
-
19
-
20
-
21
-
22
-
23
-
24
-
25
-
26
-
27
-
28
-
29
-
30
-
31
-
32
-
33
-
34
-
35
-
36
-
37
-
38
-
39
-
40
-
41
-
42
-
43
-
44
-
45
-
46
-
47
-
48
-
49
-
50
-
51
-
52
-
53
-
54
-
55
-
56
-
57
-
58
-
59
-
60
-
61
-
62
-
63
-
64
-
65
-
66
-
67
-
68
-
69
-
70
-
71
-
72
-
73
-
74
-
75
-
76
-
77
-
78
-
79
-
80
-
81
-
82
-
 83
83 -
 84
84 -
 85
85 -
 86
86 -
 87
87 -
 88
88 -
 89
89 -
 90
90 -
 91
91 -
 92
92 -
 93
93 -
 94
94 -
 95
95 -
 96
96 -
 97
97 -
 98
98 -
 99
99 -
 100
100 -
 101
101 -
 102
102 -
 103
103 -
104
-
105
-
106
-
107
-
108
-
109
-
110
-
111
-
112
-
113
-
114
-
115
-
116
-
117
-
118
-
119
-
120
-
121
-
122
-
123
-
124
-
125
-
126
-
127
-
128
-
129
-
130
-
131
-
132
-
133
-
134
-
135
-
136
-
137
-
138
-
139
-
140
-
141
-
142
-
143
-
144
-
145
-
146
-
147
-
148
 |
 |
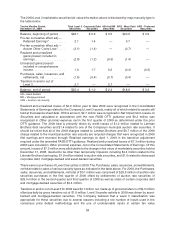
AAA or AA US Muni Education Revenue curve for student loan auction rate securities, plus a 250 basis
point liquidity premium added to the applicable discount rate of all but one auction rate security. For this
instrument, developments in the fourth quarter of 2009 raised serious concern regarding the insurer’s
ability to honor its contract. Given the distressed financial conditions of both the issuer as well as the
insurer, the fair value of the municipal bond was primarily based on the expected recoveries that holders
could realize from bankruptcy proceedings after a likely work out period of two years. A small number of
comparable trades were also considered in the valuation of this instrument which supported the discount
rate applied. Overall, the auction rate security portfolio balance decreased $2.7 million during the year and
was largely due to the $0.7 million decrease in the fair value of this security as well as higher liquidity
premiums and longer economic maturities based on the Companies assumptions regarding the auction
rate market compared to those of 2008. For comparison purposes, a summary of the year-end 2008
valuation techniques and assumptions used to measure auction rate securities is provided in the following
paragraph.
The Company performed a discounted cash flow analysis on its auction rate securities at year-end 2008,
using current coupon rates, a first quarter 2010 redemption date and a 50 basis point liquidity premium
factored into the discount rate. The result was a downward YTD mark to market adjustment of $2.5 million,
of which $1.9 million was recognized in the Consolidated Statements of Earnings as other than temporarily
impaired due to credit events involving the issuer and insurer of one security. The remaining $0.6 million
was recognized in Accumulated other comprehensive loss on the Consolidated Statements of Financial
Position representing the mark to market adjustment on all other auction rate securities.
The changes in valuation techniques and assumptions in 2009 for the Company’s auction rate securities
did not result from the application of the new fair value guidance that was effective for the Company starting
in the second quarter of 2009.
Other Level 3 Debt Securities
The Company holds certain debt instruments that it considers distressed due to reasons such as
bankruptcy or a significant downgrade in credit rating. These types of securities are valued in a
number of ways including the use of indicative pricing sources or a discounted cash flow analysis. In
limited instances, the Company has decided that the value determined by a discounted cash flow analysis
is a better indicator of fair value and has adjusted the price determined under the consensus price
methodology.
In 2009, the Company switched to an income approach when valuing its Lehman Brothers corporate debt
securities, which are the Company’s largest distressed debt instruments. The discounted cash flow
analysis was based on a detailed analysis of the bankruptcy proceedings, which resulted in expected
future recoveries of 19% on a gross basis to be paid out over one to three years. Expected future
recoveries were then discounted to 17.68% of par based on a combination of current market yields for
comparable notes and an evaluation of the risks associated with the expected recoveries. The fair value of
the Company’s Lehman Brother corporate debt securities was $0.9 million and $0.5 million at
December 31, 2009 and 2008, respectively.
In 2009, the Company transferred into Level 3 a small number of asset-backed and mortgage-backed
securities, due mostly to the consensus prices being identified for further analysis during the review of the
pricing inputs as part of the Company’s 2009 process discussed previously. The estimated fair values of
Level 3 asset-backed and mortgage-backed securities were measured using either a discounted cash flow
analysis based on collateral specific assumptions or a price that was considered indicative in nature. The
total ending fair value of these securities at December 31, 2009 was $2.4 million.
In 2008, distressed debt instruments (including Lehman) as well as various other securities for which
current, observable market data was not available were most often valued using non-binding quotes from
brokers or other indicative pricing sources. In 2009, the Company gave greater consideration to
discounted cash flow analyses, the results of which were compared to available pricing data during
the determination of fair value.
87