Lexmark 2009 Annual Report Download - page 107
Download and view the complete annual report
Please find page 107 of the 2009 Lexmark annual report below. You can navigate through the pages in the report by either clicking on the pages listed below, or by using the keyword search tool below to find specific information within the annual report.-
 1
1 -
2
-
3
-
4
-
5
-
6
-
7
-
8
-
9
-
10
-
11
-
12
-
13
-
14
-
15
-
16
-
17
-
18
-
19
-
20
-
21
-
22
-
23
-
24
-
25
-
26
-
27
-
28
-
29
-
30
-
31
-
32
-
33
-
34
-
35
-
36
-
37
-
38
-
39
-
40
-
41
-
42
-
43
-
44
-
45
-
46
-
47
-
48
-
49
-
50
-
51
-
52
-
53
-
54
-
55
-
56
-
57
-
58
-
59
-
60
-
61
-
62
-
63
-
64
-
65
-
66
-
67
-
68
-
69
-
70
-
71
-
72
-
73
-
74
-
75
-
76
-
77
-
78
-
79
-
80
-
81
-
82
-
83
-
84
-
85
-
86
-
87
-
88
-
89
-
90
-
91
-
92
-
93
-
94
-
95
-
96
-
 97
97 -
 98
98 -
 99
99 -
 100
100 -
 101
101 -
 102
102 -
 103
103 -
 104
104 -
 105
105 -
 106
106 -
 107
107 -
 108
108 -
 109
109 -
 110
110 -
 111
111 -
 112
112 -
 113
113 -
 114
114 -
 115
115 -
 116
116 -
 117
117 -
118
-
119
-
120
-
121
-
122
-
123
-
124
-
125
-
126
-
127
-
128
-
129
-
130
-
131
-
132
-
133
-
134
-
135
-
136
-
137
-
138
-
139
-
140
-
141
-
142
-
143
-
144
-
145
-
146
-
147
-
148
 |
 |

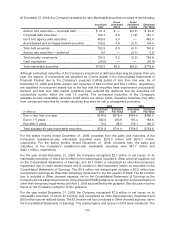
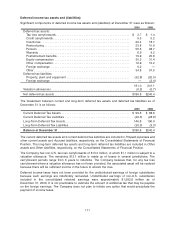
At December 31, 2008, the Company’s available-for-sale Marketable securities consisted of the following:
Amortized
Cost
Gross
Unrealized
Gains
Gross
Unrealized
Losses
Estimated
Fair Value
Auction rate securities — municipal debt . . . . . . . . . $ 21.4 $ — $(0.5) $ 20.9
Corporate debt securities . . . . . . . . . . . . . . . . . . . . . 162.7 0.9 (1.9) 161.7
Gov’t and agency debt securities . . . . . . . . . . . . . . . 458.9 5.0 — 463.9
Asset-backed and mortgage-backed securities. . . . . 109.5 0.6 (5.7) 104.4
Total debt securities . . . . . . . . . . . . . . . . . . . . . . . . . 752.5 6.5 (8.1) 750.9
Auction rate securities — preferred . . . . . . . . . . . . . 4.0 — (0.1) 3.9
Total security investments . . . . . . . . . . . . . . . . . . . . 756.5 6.5 (8.2) 754.8
Cash equivalents . . . . . . . . . . . . . . . . . . . . . . . . . . . (36.0) — — (36.0)
Total marketable securities. . . . . . . . . . . . . . . . . . . . $720.5 $6.5 $(8.2) $718.8
Although contractual maturities of the Company’s investment in debt securities may be greater than one
year, the majority of investments are classified as Current assets in the Consolidated Statements of
Financial Position due to the Company’s expected holding period of less than one year. As of
December 31, 2009 and 2008, auction rate securities of $22.0 million and $24.7 million, respectively,
are classified in noncurrent assets due to the fact that the securities have experienced unsuccessful
auctions and that poor debt market conditions have reduced the likelihood that the securities will
successfully auction within the next 12 months. The contractual maturities of the Company’s
available-for-sale marketable securities noted above are shown below. Expected maturities may differ
from contractual maturities for certain securities that allow for call or prepayment provisions.
(In Millions)
Amortized
Cost
Estimated
Fair Value
Amortized
Cost
Estimated
Fair Value
2009 2008
Due in less than one year . . . . . . . . . . . . . . . . . . . . . $278.9 $279.4 $464.0 $466.0
Due in 1-5 years . . . . . . . . . . . . . . . . . . . . . . . . . . . . 382.6 383.6 187.4 188.6
Due after 5 years . . . . . . . . . . . . . . . . . . . . . . . . . . . 70.4 68.0 105.1 100.2
Total available-for-sale marketable securities . . . . . . . $731.9 $731.0 $756.5 $754.8
For the twelve months ended December 31, 2009, proceeds from the sales and maturities of the
Company’s available-for-sale marketable securities were $215.0 million and $679.7 million,
respectively. For the twelve months ended December 31, 2008, proceeds from the sales and
maturities of the Company’s available-for-sale marketable securities were $91.7 million and
$442.1 million, respectively.
For the year ended December 31, 2009, the Company recognized $2.7 million in net losses on its
marketable securities; of which $0.4 million is net realized gains included in Other (income) expense, net
on the Consolidated Statements of Earnings, and $3.1 million is recognized as other-than-temporary
impairment due to credit related losses and is included in Net impairment losses on securities on the
Consolidated Statements of Earnings. The $0.4 million net realized gain includes a $0.2 million loss
recognized in earnings as other-than-temporary impairment in the first quarter of 2009. The $0.2 million
loss is included in Other (income) expense, net on the Consolidated Statements of Earnings as the
Company did not adopt the provisions of the amended FASB guidance on recognition and presentation of
other-than-temporary impairments until April 1, 2009 as permitted by the guidance. See discussion further
below on the Company’s adoption of this guidance.
For the year ended December 31, 2008, the Company recognized $7.9 million in net losses on its
marketable securities, of which $7.3 million was recognized as other-than-temporary impairment and
$0.6 million was net realized losses. The $7.9 million net loss is included in Other (income) expense, net on
the Consolidated Statements of Earnings. The realized gains and losses in 2007 were immaterial. The
101