Lexmark 2009 Annual Report Download - page 47
Download and view the complete annual report
Please find page 47 of the 2009 Lexmark annual report below. You can navigate through the pages in the report by either clicking on the pages listed below, or by using the keyword search tool below to find specific information within the annual report.-
 1
1 -
2
-
3
-
4
-
5
-
6
-
7
-
8
-
9
-
10
-
11
-
12
-
13
-
14
-
15
-
16
-
17
-
18
-
19
-
20
-
21
-
22
-
23
-
24
-
25
-
26
-
27
-
28
-
29
-
30
-
31
-
32
-
33
-
34
-
35
-
36
-
 37
37 -
 38
38 -
 39
39 -
 40
40 -
 41
41 -
 42
42 -
 43
43 -
 44
44 -
 45
45 -
 46
46 -
 47
47 -
 48
48 -
 49
49 -
 50
50 -
 51
51 -
 52
52 -
 53
53 -
 54
54 -
 55
55 -
 56
56 -
 57
57 -
58
-
59
-
60
-
61
-
62
-
63
-
64
-
65
-
66
-
67
-
68
-
69
-
70
-
71
-
72
-
73
-
74
-
75
-
76
-
77
-
78
-
79
-
80
-
81
-
82
-
83
-
84
-
85
-
86
-
87
-
88
-
89
-
90
-
91
-
92
-
93
-
94
-
95
-
96
-
97
-
98
-
99
-
100
-
101
-
102
-
103
-
104
-
105
-
106
-
107
-
108
-
109
-
110
-
111
-
112
-
113
-
114
-
115
-
116
-
117
-
118
-
119
-
120
-
121
-
122
-
123
-
124
-
125
-
126
-
127
-
128
-
129
-
130
-
131
-
132
-
133
-
134
-
135
-
136
-
137
-
138
-
139
-
140
-
141
-
142
-
143
-
144
-
145
-
146
-
147
-
148
 |
 |

Provision for Income Taxes and Related Matters
The Company’s effective income tax rate was approximately 22.0%, 12.9% and 13.9% in 2009, 2008 and
2007, respectively. See Note 12 to the Consolidated Financial Statements in Part II, Item 8 for a
reconciliation of the Company’s effective tax rate to the U.S. statutory rate.
The 9.1 percentage point increase of the effective tax rate from 2008 to 2009 was due to a geographic shift
in earnings (5.1 percentage points) toward higher tax jurisdictions in 2009 and the reversal of previously-
accrued taxes (3.1 percentage points) in 2008 that did not recur in 2009, along with a variety of other
factors (0.9 percentage points).
The 1.0 percentage point reduction of the effective tax rate from 2007 to 2008 was due to a reduction of
5.3 percentage points, primarily related to the geographic shift in earnings to lower tax jurisdictions in
2008, along with a variety of other factors, partially offset by a smaller amount of reversals and adjustments
to previously accrued taxes in 2008 (increase of 4.3 percentage points) when compared to reversals and
adjustments recorded in 2007. During 2008, the Company reversed $11.6 million of previously accrued
taxes principally due to the settlement of the U.S. tax audit for years 2004 and 2005, while in 2007, the
Company reversed a total of $29.6 million of previously accrued taxes which pertained to the settlement of
a tax audit outside the U.S. and other adjustments to previously recorded tax amounts.
Net Earnings
Net earnings for the year ended December 31, 2009 decreased 39% from the prior year primarily due to
lower operating income and lower interest and other income/expense, net. Net earnings in 2009 included
$141.3 million of pre-tax restructuring-related charges and project costs in connection with the Company’s
restructuring activities versus $92.7 million in 2008. See “Restructuring and Related Charges and Project
Costs” that follows for further discussion.
Net earnings for the year ended December 31, 2008 decreased 20% from the prior year primarily due to
lower operating income partially offset by a lower effective tax rate. Net earnings in 2008 included
$92.7 million of pre-tax restructuring-related charges and project costs in connection with the Company’s
restructuring activities versus $52.0 million in 2007. See “Restructuring and Related Charges and Project
Costs” that follows for further discussion. Net earnings in 2008 also included $12 million of non-recurring
tax benefits.
Net earnings in 2007 included $52.0 million (net of a $3.5 million pre-tax gain on the sale of the Rosyth,
Scotland facility) of pre-tax restructuring-related charges and project costs. See “Restructuring and
Related Charges and Project Costs” that follows for further discussion. Net earnings in 2007 also
included an $8.1 million pre-tax foreign exchange gain realized upon the substantial liquidation of the
Company’s Scotland entity and $29 million of non-recurring tax benefits.
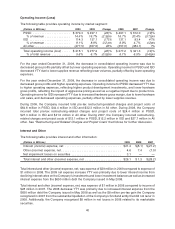
Earnings per Share
The following table summarizes basic and diluted net earnings per share:
2009 2008 2007
Net earnings per share:
Basic . . . . . . . . . . . . . . . . . . . . . . . . . . . . . . . . . . . . . . . . . . . . . . . . . . . $1.87 $2.70 $3.16
Diluted . . . . . . . . . . . . . . . . . . . . . . . . . . . . . . . . . . . . . . . . . . . . . . . . . . 1.86 2.69 3.14
For the year ended December 31, 2009, the decreases in basic and diluted net earnings per share YTY
were attributable to decreased earnings partially offset by the decreases in the average number of shares
outstanding.
For the year ended December 31, 2008, the decreases in basic and diluted net earnings per share YTY
were attributable to decreased earnings partially offset by the decreases in the average number of shares
outstanding, primarily due to the Company’s stock repurchases.
41