Lexmark 2009 Annual Report Download - page 133
Download and view the complete annual report
Please find page 133 of the 2009 Lexmark annual report below. You can navigate through the pages in the report by either clicking on the pages listed below, or by using the keyword search tool below to find specific information within the annual report.-
 1
1 -
2
-
3
-
4
-
5
-
6
-
7
-
8
-
9
-
10
-
11
-
12
-
13
-
14
-
15
-
16
-
17
-
18
-
19
-
20
-
21
-
22
-
23
-
24
-
25
-
26
-
27
-
28
-
29
-
30
-
31
-
32
-
33
-
34
-
35
-
36
-
37
-
38
-
39
-
40
-
41
-
42
-
43
-
44
-
45
-
46
-
47
-
48
-
49
-
50
-
51
-
52
-
53
-
54
-
55
-
56
-
57
-
58
-
59
-
60
-
61
-
62
-
63
-
64
-
65
-
66
-
67
-
68
-
69
-
70
-
71
-
72
-
73
-
74
-
75
-
76
-
77
-
78
-
79
-
80
-
81
-
82
-
83
-
84
-
85
-
86
-
87
-
88
-
89
-
90
-
91
-
92
-
93
-
94
-
95
-
96
-
97
-
98
-
99
-
100
-
101
-
102
-
103
-
104
-
105
-
106
-
107
-
108
-
109
-
110
-
111
-
112
-
113
-
114
-
115
-
116
-
117
-
118
-
119
-
120
-
121
-
122
-
 123
123 -
 124
124 -
 125
125 -
 126
126 -
 127
127 -
 128
128 -
 129
129 -
 130
130 -
 131
131 -
 132
132 -
 133
133 -
 134
134 -
 135
135 -
 136
136 -
 137
137 -
 138
138 -
 139
139 -
 140
140 -
 141
141 -
 142
142 -
 143
143 -
144
-
145
-
146
-
147
-
148
 |
 |

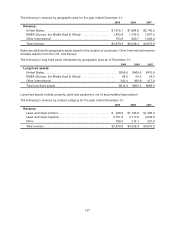
The following is revenue by geographic area for the year ended December 31:
2009 2008 2007
Revenue:
United States . . . . . . . . . . . . . . . . . . . . . . . . . . . . . . . . . . . . . . $1,672.1 $1,864.8 $2,140.3
EMEA (Europe, the Middle East & Africa) . . . . . . . . . . . . . . . . 1,453.9 1,742.9 1,827.2
Other International . . . . . . . . . . . . . . . . . . . . . . . . . . . . . . . . . . 753.9 920.7 1,006.4
Total revenue . . . . . . . . . . . . . . . . . . . . . . . . . . . . . . . . . . . . . . $3,879.9 $4,528.4 $4,973.9
Sales are attributed to geographic areas based on the location of customers. Other International revenue
includes exports from the U.S. and Europe.
The following is long-lived asset information by geographic area as of December 31:
2009 2008 2007
Long-lived assets:
United States . . . . . . . . . . . . . . . . . . . . . . . . . . . . . . . . . . . . . . . . . . $508.0 $468.8 $416.9
EMEA (Europe, the Middle East & Africa) . . . . . . . . . . . . . . . . . . . . . 64.5 24.5 34.3
Other International . . . . . . . . . . . . . . . . . . . . . . . . . . . . . . . . . . . . . . 342.4 369.9 417.8
Total long-lived assets . . . . . . . . . . . . . . . . . . . . . . . . . . . . . . . . . . . $914.9 $863.2 $869.0
Long-lived assets include property, plant and equipment, net of accumulated depreciation.
The following is revenue by product category for the year ended December 31:
2009 2008 2007
Revenue:
Laser and inkjet printers. . . . . . . . . . . . . . . . . . . . . . . . . . . . . . $ 938.8 $1,196.8 $1,498.3
Laser and inkjet supplies . . . . . . . . . . . . . . . . . . . . . . . . . . . . . 2,751.8 3,117.5 3,248.6
Other . . . . . . . . . . . . . . . . . . . . . . . . . . . . . . . . . . . . . . . . . . . . 189.3 214.1 227.0
Total revenue . . . . . . . . . . . . . . . . . . . . . . . . . . . . . . . . . . . . . . $3,879.9 $4,528.4 $4,973.9
127