Lexmark 2009 Annual Report Download - page 90
Download and view the complete annual report
Please find page 90 of the 2009 Lexmark annual report below. You can navigate through the pages in the report by either clicking on the pages listed below, or by using the keyword search tool below to find specific information within the annual report.-
 1
1 -
2
-
3
-
4
-
5
-
6
-
7
-
8
-
9
-
10
-
11
-
12
-
13
-
14
-
15
-
16
-
17
-
18
-
19
-
20
-
21
-
22
-
23
-
24
-
25
-
26
-
27
-
28
-
29
-
30
-
31
-
32
-
33
-
34
-
35
-
36
-
37
-
38
-
39
-
40
-
41
-
42
-
43
-
44
-
45
-
46
-
47
-
48
-
49
-
50
-
51
-
52
-
53
-
54
-
55
-
56
-
57
-
58
-
59
-
60
-
61
-
62
-
63
-
64
-
65
-
66
-
67
-
68
-
69
-
70
-
71
-
72
-
73
-
74
-
75
-
76
-
77
-
78
-
79
-
 80
80 -
 81
81 -
 82
82 -
 83
83 -
 84
84 -
 85
85 -
 86
86 -
 87
87 -
 88
88 -
 89
89 -
 90
90 -
 91
91 -
 92
92 -
 93
93 -
 94
94 -
 95
95 -
 96
96 -
 97
97 -
 98
98 -
 99
99 -
 100
100 -
101
-
102
-
103
-
104
-
105
-
106
-
107
-
108
-
109
-
110
-
111
-
112
-
113
-
114
-
115
-
116
-
117
-
118
-
119
-
120
-
121
-
122
-
123
-
124
-
125
-
126
-
127
-
128
-
129
-
130
-
131
-
132
-
133
-
134
-
135
-
136
-
137
-
138
-
139
-
140
-
141
-
142
-
143
-
144
-
145
-
146
-
147
-
148
 |
 |

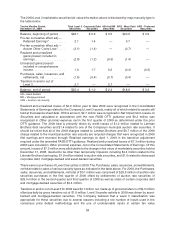
The 2009 Level 3 marketable securities fair value information above is disclosed by major security type in
the table below.
Twelve Months Ended,
December 31, 2009
Total Level 3
Securities
Corporate Debt
Securities
AB And MB
Securities
ARS - Muni Debt
Securities
ARS - Preferred
Securities
Balance, beginning of period . . . . $26.1 $ 0.9 $ 0.5 $20.8 $ 3.9
Pre-tax cumulative effect adj —
Retained Earnings* . . . . . . . . . 2.1 1.4 — 0.7 —
Pre-tax cumulative effect adj —
Accum Other Comp Loss* . . . . (2.1) (1.4) — (0.7) —
Realized and unrealized
gains/(losses) included in
earnings. . . . . . . . . . . . . . . . . . (2.9) (1.2) (0.3) (1.4) —
Unrealized gains/(losses)
included in comprehensive
income. . . . . . . . . . . . . . . . . . . 1.0 1.7 0.2 (0.4) (0.5)
Purchases, sales, issuances, and
settlements, net . . . . . . . . . . . . (1.5) (0.4) (0.7) (0.4) —
Transfers in and/or out of
Level3................... 2.7 — 2.7 — —
Balance, end of period. . . . . . . . . $25.4 $ 1.0 $ 2.4 $18.6 $ 3.4
AB = Asset-backed
MB = Mortgage-backed
ARS = Auction rate security
Realized and unrealized losses of $2.9 million year to date 2009 were recognized in the Consolidated
Statements of Earnings related to the Company’s Level 3 assets, nearly all of which related to assets still
held at the balance sheet date. Of this amount, $2.7 million was recognized in Net Impairment Losses on
Securities and calculated in accordance with the new FASB OTTI guidance and $0.2 million was
recognized in Other (income) expense, net in the first quarter of 2009 as determined under the prior
OTTI guidance. The 2009 total is primarily driven by credit losses of $1.2 million related to Lehman
Brothers debt securities and $1.4 related to one of the Company’s municipal auction rate securities. It
should be noted that all of the 2009 charges related to Lehman Brothers and $0.7 million of the 2009
charge related to the municipal auction rate security are recycled charges that were recognized in 2008
Net earnings and reversed through Retained earnings on April 1, 2009 in the transition adjustment
required under the amended FASB OTTI guidance. Realized and unrealized losses of $7.3 million during
2008 were included in Other (income) expense, net on the Consolidated Statements of Earnings. Of this
amount, losses of $7.3 million were attributable to the change in fair value of marketable securities held at
December 31, 2008, deemed to be other than temporarily impaired, including $4.4 million related to the
Lehman Brothers bankruptcy, $1.9 million related to auction rate securities, and $1.0 related to distressed
corporate debt, mortgage-backed and asset-backed securities.
There were no purchases of Level 3 securities in 2009. The Purchases, sales, issuances, and settlements,
net total relate to sales of various security types as indicated in the table above. For 2008, the Purchases,
sales, issuances, and settlements, net total of $0.1 million was comprised of $28.5 million of auction rate
securities purchases in the first quarter of 2008 offset by settlements of auction rate securities of
$28.0 million in the second quarter and third quarter of 2008 as well as sales of certain corporate debt
and mortgage-backed securities of $0.4 million.
Transfers in and/or out of Level 3 for 2009 were $2.7 million net, made up of gross transfers in of $4.5 million
offset partially by gross transfers out of $1.8 million. Level 3 transfer activity in 2009 was driven by asset-
backed and mortgage-backed securities. The Company believed that a Level 3 classification was
appropriate for these securities due to several reasons including a low number of inputs used in the
consensus price default methodology and the use of unobservable inputs in certain fair value
84