Lexmark 2009 Annual Report Download - page 42
Download and view the complete annual report
Please find page 42 of the 2009 Lexmark annual report below. You can navigate through the pages in the report by either clicking on the pages listed below, or by using the keyword search tool below to find specific information within the annual report.-
 1
1 -
2
-
3
-
4
-
5
-
6
-
7
-
8
-
9
-
10
-
11
-
12
-
13
-
14
-
15
-
16
-
17
-
18
-
19
-
20
-
21
-
22
-
23
-
24
-
25
-
26
-
27
-
28
-
29
-
30
-
31
-
 32
32 -
 33
33 -
 34
34 -
 35
35 -
 36
36 -
 37
37 -
 38
38 -
 39
39 -
 40
40 -
 41
41 -
 42
42 -
 43
43 -
 44
44 -
 45
45 -
 46
46 -
 47
47 -
 48
48 -
 49
49 -
 50
50 -
 51
51 -
 52
52 -
53
-
54
-
55
-
56
-
57
-
58
-
59
-
60
-
61
-
62
-
63
-
64
-
65
-
66
-
67
-
68
-
69
-
70
-
71
-
72
-
73
-
74
-
75
-
76
-
77
-
78
-
79
-
80
-
81
-
82
-
83
-
84
-
85
-
86
-
87
-
88
-
89
-
90
-
91
-
92
-
93
-
94
-
95
-
96
-
97
-
98
-
99
-
100
-
101
-
102
-
103
-
104
-
105
-
106
-
107
-
108
-
109
-
110
-
111
-
112
-
113
-
114
-
115
-
116
-
117
-
118
-
119
-
120
-
121
-
122
-
123
-
124
-
125
-
126
-
127
-
128
-
129
-
130
-
131
-
132
-
133
-
134
-
135
-
136
-
137
-
138
-
139
-
140
-
141
-
142
-
143
-
144
-
145
-
146
-
147
-
148
 |
 |

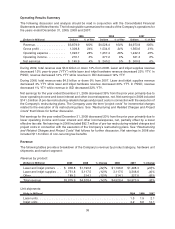
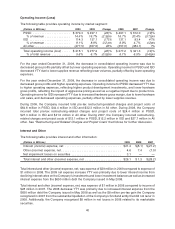
Operating Results Summary
The following discussion and analysis should be read in conjunction with the Consolidated Financial
Statements and Notes thereto. The following table summarizes the results of the Company’s operations for
the years ended December 31, 2009, 2008 and 2007:
(Dollars in Millions) Dollars % of Rev Dollars % of Rev Dollars % of Rev
2009 2008 2007
Revenue. . . . . . . . . . . . . . . . . . $3,879.9 100% $4,528.4 100% $4,973.9 100%
Gross profit . . . . . . . . . . . . . . . 1,309.8 34% 1,534.6 34% 1,563.6 31%
Operating expense . . . . . . . . . . 1,093.7 28% 1,257.4 28% 1,242.3 25%
Operating income . . . . . . . . . . . 216.1 6% 277.2 6% 321.3 6%
Net earnings. . . . . . . . . . . . . . . $ 145.9 4% $ 240.2 5% $ 300.8 6%
During 2009, total revenue was $3.9 billion or down 14% from 2008. Laser and inkjet supplies revenue
decreased 12% year-to-year (“YTY”) while laser and inkjet hardware revenue decreased 22% YTY. In
PSSD, revenue decreased 12% YTY while revenue in ISD decreased 19% YTY.
During 2008, total revenue was $4.5 billion or down 9% from 2007. Laser and inkjet supplies revenue
decreased 4% YTY while laser and inkjet hardware revenue decreased 20% YTY. In PSSD, revenue
decreased 1% YTY while revenue in ISD decreased 22% YTY.
Net earnings for the year ended December 31, 2009 decreased 39% from the prior year primarily due to
lower operating income and lower interest and other income/expense, net. Net earnings in 2009 included
$141.3 million of pre-tax restructuring-related charges and project costs in connection with the execution of
the Company’s restructuring plans. The Company uses the term “project costs” for incremental charges
related to the execution of its restructuring plans. See “Restructuring and Related Charges and Project
Costs” that follows for further discussion.
Net earnings for the year ended December 31, 2008 decreased 20% from the prior year primarily due to
lower operating income and lower interest and other income/expense, net, partially offset by a lower
effective tax rate. Net earnings in 2008 included $92.7 million of pre-tax restructuring-related charges and
project costs in connection with the execution of the Company’s restructuring plans. See “Restructuring
and Related Charges and Project Costs” that follows for further discussion. Net earnings in 2008 also
included $11.6 million of non-recurring tax benefits.
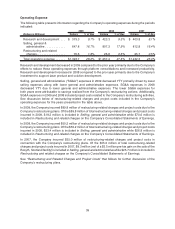
Revenue
The following tables provide a breakdown of the Company’s revenue by product category, hardware unit
shipments and market segment:
Revenue by product:
(Dollars in Millions) 2009 2008 % Change 2008 2007 % Change
Laser and inkjet printers . . . $ 938.8 $1,196.8 (22)% $1,196.8 $1,498.3 (20)%
Laser and inkjet supplies . . . 2,751.8 3,117.5 (12)% 3,117.5 3,248.6 (4)%
Other . . . . . . . . . . . . . . . . . . 189.3 214.1 (12)% 214.1 227.0 (6)%
Total revenue . . . . . . . . . . . . $3,879.9 $4,528.4 (14)% $4,528.4 $4,973.9 (9)%
Unit shipments:
(Units in Millions) 2009 2008 2007
Laser units . . . . . . . . . . . . . . . . . . . . . . . . . . . . . . . . . . . . . . . . . . . . . . . . . . . . 1.5 1.9 2.1
Inkjet units . . . . . . . . . . . . . . . . . . . . . . . . . . . . . . . . . . . . . . . . . . . . . . . . . . . . 4.2 6.6 12.1
36