Lexmark 2009 Annual Report Download - page 132
Download and view the complete annual report
Please find page 132 of the 2009 Lexmark annual report below. You can navigate through the pages in the report by either clicking on the pages listed below, or by using the keyword search tool below to find specific information within the annual report.-
 1
1 -
2
-
3
-
4
-
5
-
6
-
7
-
8
-
9
-
10
-
11
-
12
-
13
-
14
-
15
-
16
-
17
-
18
-
19
-
20
-
21
-
22
-
23
-
24
-
25
-
26
-
27
-
28
-
29
-
30
-
31
-
32
-
33
-
34
-
35
-
36
-
37
-
38
-
39
-
40
-
41
-
42
-
43
-
44
-
45
-
46
-
47
-
48
-
49
-
50
-
51
-
52
-
53
-
54
-
55
-
56
-
57
-
58
-
59
-
60
-
61
-
62
-
63
-
64
-
65
-
66
-
67
-
68
-
69
-
70
-
71
-
72
-
73
-
74
-
75
-
76
-
77
-
78
-
79
-
80
-
81
-
82
-
83
-
84
-
85
-
86
-
87
-
88
-
89
-
90
-
91
-
92
-
93
-
94
-
95
-
96
-
97
-
98
-
99
-
100
-
101
-
102
-
103
-
104
-
105
-
106
-
107
-
108
-
109
-
110
-
111
-
112
-
113
-
114
-
115
-
116
-
117
-
118
-
119
-
120
-
121
-
 122
122 -
 123
123 -
 124
124 -
 125
125 -
 126
126 -
 127
127 -
 128
128 -
 129
129 -
 130
130 -
 131
131 -
 132
132 -
 133
133 -
 134
134 -
 135
135 -
 136
136 -
 137
137 -
 138
138 -
 139
139 -
 140
140 -
 141
141 -
 142
142 -
143
-
144
-
145
-
146
-
147
-
148
 |
 |

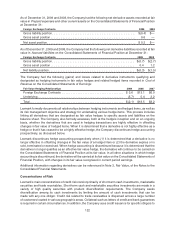
For sales of AIO/MFDs and single function printer devices in Germany after January 1, 2008, the
Company, other industry participants and the collecting societies have agreed upon an applicable levy
rate for the aforementioned devices and the Company has agreed to collect and pay such levies as
appropriate.
The Company believes the amounts accrued represent its best estimate of the copyright fee issues
currently pending and these accruals are included in Accrued liabilities on the Consolidated Statements of
Financial Position.
18. SEGMENT DATA
Lexmark manufactures and sells a variety of printing and multifunction products and related supplies and
services and is primarily managed along its divisional segments, PSSD and ISD. The Company evaluates
the performance of its segments based on revenue and operating income, and does not include segment
assets or other income and expense items for management reporting purposes. Segment operating
income (loss) includes: selling, general and administrative; research and development; restructuring and
related charges; and other expenses, certain of which are allocated to the respective segments based on
internal measures and may not be indicative of amounts that would be incurred on a stand alone basis or
may not be indicative of results of other enterprises in similar businesses. All other operating income (loss)
includes significant expenses that are managed outside of the reporting segments. These unallocated
costs include such items as information technology expenses, occupancy costs, stock-based
compensation and certain other corporate and regional general and administrative expenses such as
finance, legal and human resources.
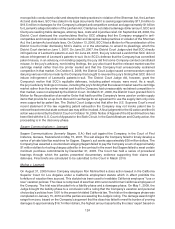
The following table includes information about the Company’s reportable segments for the year ended
December 31:
2009 2008 2007
Revenue:
PSSD . . . . . . . . . . . . . . . . . . . . . . . . . . . . . . . . . . . . . . . . . . . $2,624.9 $2,981.6 $2,999.2
ISD . . . . . . . . . . . . . . . . . . . . . . . . . . . . . . . . . . . . . . . . . . . . . 1,255.0 1,546.8 1,974.7
Total revenue . . . . . . . . . . . . . . . . . . . . . . . . . . . . . . . . . . . . . . $3,879.9 $4,528.4 $4,973.9
Operating income (loss):
PSSD . . . . . . . . . . . . . . . . . . . . . . . . . . . . . . . . . . . . . . . . . . . $ 379.3 $ 497.1 $ 612.0
ISD . . . . . . . . . . . . . . . . . . . . . . . . . . . . . . . . . . . . . . . . . . . . . 114.3 137.1 93.4
All other . . . . . . . . . . . . . . . . . . . . . . . . . . . . . . . . . . . . . . . . . . (277.5) (357.0) (384.1)
Total operating income (loss) . . . . . . . . . . . . . . . . . . . . . . . . . . $ 216.1 $ 277.2 $ 321.3
Operating income (loss) noted above for the year ended December 31, 2009 includes restructuring and
related charges of $55.1 million in PSSD, $38.5 million in ISD and $18.5 million in All other.
Operating income (loss) noted above for the year ended December 31, 2008 includes restructuring and
related charges of $19.8 million in PSSD, $23.0 million in ISD and $19.3 million in All other.
Operating income (loss) noted above for the year ended December 31, 2007 includes restructuring and
related charges of $6.5 million in PSSD, $13.9 million in ISD and $10.4 million in All other.
During 2009, 2008 and 2007, one customer, Dell, accounted for $495.9 million or approximately 13%,
$595.7 million or approximately 13% and $716.7 million or approximately 14%, of the Company’s total
revenue, respectively. Sales to Dell are included in both PSSD and ISD.
126