Lexmark 2009 Annual Report Download - page 59
Download and view the complete annual report
Please find page 59 of the 2009 Lexmark annual report below. You can navigate through the pages in the report by either clicking on the pages listed below, or by using the keyword search tool below to find specific information within the annual report.-
 1
1 -
2
-
3
-
4
-
5
-
6
-
7
-
8
-
9
-
10
-
11
-
12
-
13
-
14
-
15
-
16
-
17
-
18
-
19
-
20
-
21
-
22
-
23
-
24
-
25
-
26
-
27
-
28
-
29
-
30
-
31
-
32
-
33
-
34
-
35
-
36
-
37
-
38
-
39
-
40
-
41
-
42
-
43
-
44
-
45
-
46
-
47
-
48
-
 49
49 -
 50
50 -
 51
51 -
 52
52 -
 53
53 -
 54
54 -
 55
55 -
 56
56 -
 57
57 -
 58
58 -
 59
59 -
 60
60 -
 61
61 -
 62
62 -
 63
63 -
 64
64 -
 65
65 -
 66
66 -
 67
67 -
 68
68 -
 69
69 -
70
-
71
-
72
-
73
-
74
-
75
-
76
-
77
-
78
-
79
-
80
-
81
-
82
-
83
-
84
-
85
-
86
-
87
-
88
-
89
-
90
-
91
-
92
-
93
-
94
-
95
-
96
-
97
-
98
-
99
-
100
-
101
-
102
-
103
-
104
-
105
-
106
-
107
-
108
-
109
-
110
-
111
-
112
-
113
-
114
-
115
-
116
-
117
-
118
-
119
-
120
-
121
-
122
-
123
-
124
-
125
-
126
-
127
-
128
-
129
-
130
-
131
-
132
-
133
-
134
-
135
-
136
-
137
-
138
-
139
-
140
-
141
-
142
-
143
-
144
-
145
-
146
-
147
-
148
 |
 |

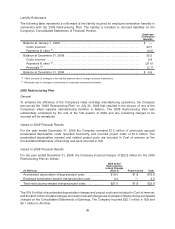
Refer to the contractual cash obligations in the pages that follow for additional information regarding items
that will likely impact the Company’s future cash flows.
The $82.1 million decrease in cash flows from operating activities from 2007 to 2008 was driven by the
following factors.
The reduction in Accounts payable was $80.1 million in 2008 compared to the $36.6 million increase in
2007. The unfavorable YTY change of $116.7 million was largely due to the timing of vendor payments. In
2007, the Company was able to lengthen the cycle in which it pays its vendors compared to that of 2006.
This resulted in a larger year-end 2007 Accounts payable balance, which was then paid in 2008 resulting in
the unfavorable YTY movement. Additionally, at year-end 2008, demand had decreased due to
increasingly difficult economic conditions compared to 2007.
The decrease in Accrued liabilities and Other assets and liabilities collectively was $63.5 million in 2008
compared to the increase in 2007 of $46.7 million. The YTY $110.2 million unfavorable impact to the
Company’s cash flows was due to many factors. Notable YTY fluctuations in cash outflows included
$21.7 million of additional cash paid for income taxes, $97.8 million paid in 2008 compared to $76.1 million
in 2007, as well as $14.3 million of additional cash paid for interest, $26.9 million paid in 2008 compared to
$12.6 million paid in 2007 due to the higher level of debt in 2008.
The activities above were partially offset by Trade receivables activity. Trade receivables decreased
$150.5 million in 2008 compared to a decrease of only $5.5 million in 2007. The favorable YTY fluctuation
of $145.0 million was driven by collections. As indicated in the cash conversion days table in the section
below, days of sales outstanding decreased 4 days from year-end 2007 to year-end 2008 due to
improvements in delinquency as well as the geographic shift in sales to faster collecting countries.
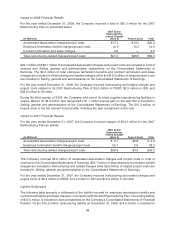
Cash Conversion Days
2009 2008 2007
Days of sales outstanding . . . . . . . . . . . . . . . . . . . . . . . . . . . . . . . . . . . . . . . . . 36 36 40
Days of inventory . . . . . . . . . . . . . . . . . . . . . . . . . . . . . . . . . . . . . . . . . . . . . . . 47 51 48
Days of payables . . . . . . . . . . . . . . . . . . . . . . . . . . . . . . . . . . . . . . . . . . . . . . . 67 65 66
Cash conversion days . . . . . . . . . . . . . . . . . . . . . . . . . . . . . . . . . . . . . . . . . . . . 16 22 22
Cash conversion days represent the number of days that elapse between the moment the Company pays
for materials and the day it collects cash from its customers. Cash conversion days are equal to days of
sales outstanding plus days of inventory less days of payables.
The days of sales outstanding are calculated using the year-end trade receivables, net of allowances, and
the average daily revenue for the quarter.
The days of inventory are calculated using the year-end net inventories balance and the average daily cost
of revenue for the quarter.
The days of payables are calculated using the year-end accounts payable balance and the average daily
cost of revenue for the quarter.
Please note that cash conversion days presented above may not be comparable to similarly titled
measures reported by other registrants.
Investing activities
The Company decreased its marketable securities investments in 2009 by $24.2 million. The Company
increased its marketable securities investments by $210.6 million and $112.9 million in 2008 and 2007,
respectively. The Company did not increase its marketable securities investments in 2009 due to the
decrease in cash flows from operations as well as the conservative investment policies pursued during
2009. Additionally, the Company made certain payments from available cash during 2009, such as
53