Lexmark 2009 Annual Report Download - page 115
Download and view the complete annual report
Please find page 115 of the 2009 Lexmark annual report below. You can navigate through the pages in the report by either clicking on the pages listed below, or by using the keyword search tool below to find specific information within the annual report.-
 1
1 -
2
-
3
-
4
-
5
-
6
-
7
-
8
-
9
-
10
-
11
-
12
-
13
-
14
-
15
-
16
-
17
-
18
-
19
-
20
-
21
-
22
-
23
-
24
-
25
-
26
-
27
-
28
-
29
-
30
-
31
-
32
-
33
-
34
-
35
-
36
-
37
-
38
-
39
-
40
-
41
-
42
-
43
-
44
-
45
-
46
-
47
-
48
-
49
-
50
-
51
-
52
-
53
-
54
-
55
-
56
-
57
-
58
-
59
-
60
-
61
-
62
-
63
-
64
-
65
-
66
-
67
-
68
-
69
-
70
-
71
-
72
-
73
-
74
-
75
-
76
-
77
-
78
-
79
-
80
-
81
-
82
-
83
-
84
-
85
-
86
-
87
-
88
-
89
-
90
-
91
-
92
-
93
-
94
-
95
-
96
-
97
-
98
-
99
-
100
-
101
-
102
-
103
-
104
-
 105
105 -
 106
106 -
 107
107 -
 108
108 -
 109
109 -
 110
110 -
 111
111 -
 112
112 -
 113
113 -
 114
114 -
 115
115 -
 116
116 -
 117
117 -
 118
118 -
 119
119 -
 120
120 -
 121
121 -
 122
122 -
 123
123 -
 124
124 -
 125
125 -
126
-
127
-
128
-
129
-
130
-
131
-
132
-
133
-
134
-
135
-
136
-
137
-
138
-
139
-
140
-
141
-
142
-
143
-
144
-
145
-
146
-
147
-
148
 |
 |

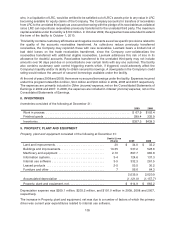
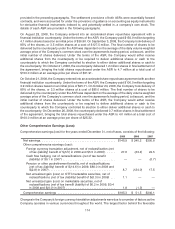
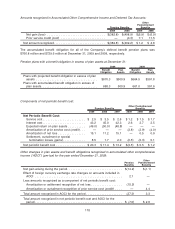
The components of Interest (income) expense, net in the Consolidated Statements of Earnings are as
follows:
2009 2008 2007
Interest (income) . . . . . . . . . . . . . . . . . . . . . . . . . . . . . . . . . . . . . . . . . . $(17.9) $(35.0) $(34.2)
Interest expense . . . . . . . . . . . . . . . . . . . . . . . . . . . . . . . . . . . . . . . . . . 39.3 28.9 13.0
Total. . . . . . . . . . . . . . . . . . . . . . . . . . . . . . . . . . . . . . . . . . . . . . . . . . . . $ 21.4 $ (6.1) $(21.2)
The Company capitalized interest costs of $3.4 million, $1.4 million and $0.2 million in 2009, 2008 and
2007, respectively.
12. INCOME TAXES
Provision for Income Taxes
The Provision for income taxes consisted of the following:
2009 2008 2007
Current:
Federal . . . . . . . . . . . . . . . . . . . . . . . . . . . . . . . . . . . . . . . . . . . . . . . . $(22.6) $ 15.2 $ 35.4
Non-U.S. . . . . . . . . . . . . . . . . . . . . . . . . . . . . . . . . . . . . . . . . . . . . . . 18.9 26.8 34.8
State and local . . . . . . . . . . . . . . . . . . . . . . . . . . . . . . . . . . . . . . . . . . 1.2 5.6 6.5
(2.5) 47.6 76.7
Deferred:
Federal . . . . . . . . . . . . . . . . . . . . . . . . . . . . . . . . . . . . . . . . . . . . . . . . 47.4 (24.8) (7.9)
Non-U.S. . . . . . . . . . . . . . . . . . . . . . . . . . . . . . . . . . . . . . . . . . . . . . . (7.1) 14.1 (20.0)
State and local . . . . . . . . . . . . . . . . . . . . . . . . . . . . . . . . . . . . . . . . . . 3.3 (1.2) (0.1)
43.6 (11.9) (28.0)
Provision for income taxes . . . . . . . . . . . . . . . . . . . . . . . . . . . . . . . . . . . $ 41.1 $ 35.7 $ 48.7
Earnings before income taxes were as follows:
2009 2008 2007
U.S. . . . . . . . . . . . . . . . . . . . . . . . . . . . . . . . . . . . . . . . . . . . . . . . . . . $ 38.3 $ 69.7 $135.7
Non-U.S. . . . . . . . . . . . . . . . . . . . . . . . . . . . . . . . . . . . . . . . . . . . . . . . 148.7 206.2 213.8
Earnings before income taxes . . . . . . . . . . . . . . . . . . . . . . . . . . . . . . . $187.0 $275.9 $349.5
The Company realized an income tax benefit from the exercise of certain stock options and/or vesting of
certain RSUs and DSUs in 2009, 2008 and 2007 of $2.8 million, $3.4 million and $3.4 million, respectively.
This benefit resulted in a decrease in current income taxes payable.
109