Lexmark 2009 Annual Report Download - page 126
Download and view the complete annual report
Please find page 126 of the 2009 Lexmark annual report below. You can navigate through the pages in the report by either clicking on the pages listed below, or by using the keyword search tool below to find specific information within the annual report.-
 1
1 -
2
-
3
-
4
-
5
-
6
-
7
-
8
-
9
-
10
-
11
-
12
-
13
-
14
-
15
-
16
-
17
-
18
-
19
-
20
-
21
-
22
-
23
-
24
-
25
-
26
-
27
-
28
-
29
-
30
-
31
-
32
-
33
-
34
-
35
-
36
-
37
-
38
-
39
-
40
-
41
-
42
-
43
-
44
-
45
-
46
-
47
-
48
-
49
-
50
-
51
-
52
-
53
-
54
-
55
-
56
-
57
-
58
-
59
-
60
-
61
-
62
-
63
-
64
-
65
-
66
-
67
-
68
-
69
-
70
-
71
-
72
-
73
-
74
-
75
-
76
-
77
-
78
-
79
-
80
-
81
-
82
-
83
-
84
-
85
-
86
-
87
-
88
-
89
-
90
-
91
-
92
-
93
-
94
-
95
-
96
-
97
-
98
-
99
-
100
-
101
-
102
-
103
-
104
-
105
-
106
-
107
-
108
-
109
-
110
-
111
-
112
-
113
-
114
-
115
-
 116
116 -
 117
117 -
 118
118 -
 119
119 -
 120
120 -
 121
121 -
 122
122 -
 123
123 -
 124
124 -
 125
125 -
 126
126 -
 127
127 -
 128
128 -
 129
129 -
 130
130 -
 131
131 -
 132
132 -
 133
133 -
 134
134 -
 135
135 -
 136
136 -
137
-
138
-
139
-
140
-
141
-
142
-
143
-
144
-
145
-
146
-
147
-
148
 |
 |

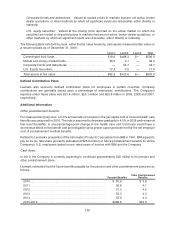
Corporate bonds and debentures: Valued at quoted prices in markets that are not active, broker
dealer quotations, or other methods by which all significant inputs are observable, either directly or
indirectly.
U.S. equity securities: Valued at the closing price reported on the active market on which the
securities are traded or at quoted prices in markets that are not active, broker dealer quotations, or
other methods by which all significant inputs are observable, either directly or indirectly.
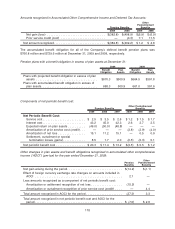
The following table sets forth by level, within the fair value hierarchy, plan assets measured at fair value on
a recurring basis as of December 31, 2009:
Level 1 Level 2 Level 3 Total
Commingled trust funds . . . . . . . . . . . . . . . . . . . . . . . . . . . . . $18.6 $488.3 $— $506.9
Mutual and money market funds. . . . . . . . . . . . . . . . . . . . . . . 46.3 0.1 — 46.4
Corporate bonds and debentures . . . . . . . . . . . . . . . . . . . . . . — 34.7 — 34.7
U.S. Equity Securities . . . . . . . . . . . . . . . . . . . . . . . . . . . . . . . 17.4 0.5 — 17.9
Total assets at fair value . . . . . . . . . . . . . . . . . . . . . . . . . . . . . $82.3 $523.6 $— $605.9
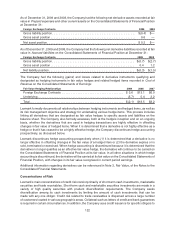
Defined Contribution Plans
Lexmark also sponsors defined contribution plans for employees in certain countries. Company
contributions are generally based upon a percentage of employees’ contributions. The Company’s
expense under these plans was $21.4 million, $25.1 million and $25.8 million in 2009, 2008 and 2007,
respectively.
Additional Information
Other postretirement benefits:
For measurement purposes, a 8.3% annual rate of increase in the per capita cost of covered health care
benefits was assumed for 2010. The rate is assumed to decrease gradually to 4.5% in 2028 and remain at
that level thereafter. A one-percentage-point change in the health care cost trend rate would have a
de minimus effect on the benefit cost and obligation since preset caps have been met for the net employer
cost of postretirement medical benefits.
Related to Lexmark’s acquisition of the Information Products Corporation from IBM in 1991, IBM agreed to
pay for its pro rata share (currently estimated at $25.6 million) of future postretirement benefits for all the
Company’s U.S. employees based on pro rated years of service with IBM and the Company.
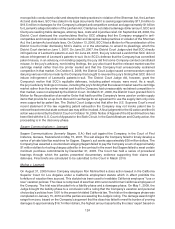
Cash flows:
In 2010, the Company is currently expecting to contribute approximately $20 million to its pension and
other postretirement plans.
Lexmark estimates that the future benefits payable for the pension and other postretirement plans are as
follows:
Pension Benefits
Other Postretirement
Benefits
2010. . . . . . . . . . . . . . . . . . . . . . . . . . . . . . . . . . . . . . . . . . . . $ 50.6 $ 3.6
2011. . . . . . . . . . . . . . . . . . . . . . . . . . . . . . . . . . . . . . . . . . . . 50.8 4.1
2012. . . . . . . . . . . . . . . . . . . . . . . . . . . . . . . . . . . . . . . . . . . . 51.3 4.2
2013. . . . . . . . . . . . . . . . . . . . . . . . . . . . . . . . . . . . . . . . . . . . 53.3 4.3
2014. . . . . . . . . . . . . . . . . . . . . . . . . . . . . . . . . . . . . . . . . . . . 55.8 4.4
2015-2019 . . . . . . . . . . . . . . . . . . . . . . . . . . . . . . . . . . . . . . . $286.6 $23.5
120