Kraft 2012 Annual Report Download - page 92
Download and view the complete annual report
Please find page 92 of the 2012 Kraft annual report below. You can navigate through the pages in the report by either clicking on the pages listed below, or by using the keyword search tool below to find specific information within the annual report.-
 1
1 -
2
-
3
-
4
-
5
-
6
-
7
-
8
-
9
-
10
-
11
-
12
-
13
-
14
-
15
-
16
-
17
-
18
-
19
-
20
-
21
-
22
-
23
-
24
-
25
-
26
-
27
-
28
-
29
-
30
-
31
-
32
-
33
-
34
-
35
-
36
-
37
-
38
-
39
-
40
-
41
-
42
-
43
-
44
-
45
-
46
-
47
-
48
-
49
-
50
-
51
-
52
-
53
-
54
-
55
-
56
-
57
-
58
-
59
-
60
-
61
-
62
-
63
-
64
-
65
-
66
-
67
-
68
-
69
-
70
-
71
-
72
-
73
-
74
-
75
-
76
-
77
-
78
-
79
-
80
-
81
-
 82
82 -
 83
83 -
 84
84 -
 85
85 -
 86
86 -
 87
87 -
 88
88 -
 89
89 -
 90
90 -
 91
91 -
 92
92 -
 93
93 -
 94
94 -
 95
95 -
 96
96 -
 97
97
 |
 |

EXHIBIT 12.1
Kraft Foods Group, Inc.
Computation of Ratios of Earnings to Fixed Charges
(in millions of dollars)
Years Ended
December 29,
2012
December 31,
2011
December 31,
2010
December 31,
2009
December 31,
2008
Earnings from continuing operations before income taxes $ 2,453 $ 2,876 $ 3,002 $ 2,910 $ 2,112
Add / (Deduct):
Fixed charges 299 67 65 96 80
Interest capitalized, net of amortization 1 1 1 - (2)
Earnings available for fixed charges $ 2,753 $ 2,944 $ 3,068 $ 3,006 $ 2,190
Fixed charges:
Interest incurred:
Interest expense (a) $ 258 $ 10 $ 8 $ 35 $ 26
Capitalized interest 11123
259 11 9 37 29
Portion of rent expense deemed to represent interest factor 40 56 56 59 51
Fixed charges $ 299 $ 67 $ 65 $ 96 $ 80
Ratio of earnings to fixed charges 9.2 43.9 47.2 31.3 27.4
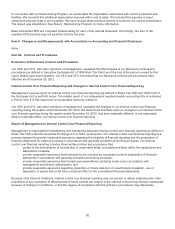
Notes:
(a) Excludes interest related to uncertain tax positions, which is recorded in our tax provision.