Kraft 2012 Annual Report Download - page 29
Download and view the complete annual report
Please find page 29 of the 2012 Kraft annual report below. You can navigate through the pages in the report by either clicking on the pages listed below, or by using the keyword search tool below to find specific information within the annual report.-
 1
1 -
2
-
3
-
4
-
5
-
6
-
7
-
8
-
9
-
10
-
11
-
12
-
13
-
14
-
15
-
16
-
17
-
18
-
 19
19 -
 20
20 -
 21
21 -
 22
22 -
 23
23 -
 24
24 -
 25
25 -
 26
26 -
 27
27 -
 28
28 -
 29
29 -
 30
30 -
 31
31 -
 32
32 -
 33
33 -
 34
34 -
 35
35 -
 36
36 -
 37
37 -
 38
38 -
 39
39 -
40
-
41
-
42
-
43
-
44
-
45
-
46
-
47
-
48
-
49
-
50
-
51
-
52
-
53
-
54
-
55
-
56
-
57
-
58
-
59
-
60
-
61
-
62
-
63
-
64
-
65
-
66
-
67
-
68
-
69
-
70
-
71
-
72
-
73
-
74
-
75
-
76
-
77
-
78
-
79
-
80
-
81
-
82
-
83
-
84
-
85
-
86
-
87
-
88
-
89
-
90
-
91
-
92
-
93
-
94
-
95
-
96
-
97
 |
 |

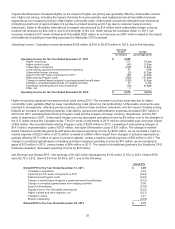
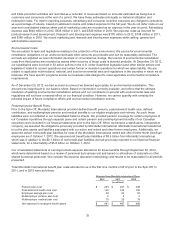
Operating Income - Operating income decreased $137 million (4.6%) to $2,828 million in 2011, due to the following:
Operating
Income Change
(in millions) (percentage point)
Operating Income for the Year Ended December 31, 2010 $ 2,965
Higher net pricing 1,116 40.0pp
Higher product costs (1,013) (36.4)pp
Unfavorable volume/mix (66) (2.3)pp
Lower selling, general and administrative expenses 68 2.5pp
Favorable foreign currency 16 0.6pp
Impact of the 53rd week of shipments in 2011 62 2.2pp
Change in market-based impacts to postemployment benefit plans (67) (2.3)pp
Change in unrealized gains/losses on hedging activities (92) (3.3)pp
Impact of divestitures (162) (5.6)pp
Other, net 1-
Operating Income for the Year Ended December 31, 2011 $ 2,828 (4.6)%
Higher pricing outpaced increased product costs during 2011. The increase in product costs was driven by significantly
higher commodity costs, partially offset by lower manufacturing costs as a result of net productivity savings. Unfavorable
volume/mix was driven by the Grocery, Cheese, and Refrigerated Meals segments. Selling, general and administrative
expenses decreased $68 million from 2010 excluding the impacts of foreign currency, divestitures, and the 53rd week of
shipments in 2011. Favorable foreign currency increased operating income by $16 million driven by the strength of the
Canadian dollar versus the U.S. dollar. The 53rd week of shipments in 2011 added $62 million in operating income. The
change in market-based impacts to postemployment benefit plans decreased operating income by $67 million, as we
recorded a mark-to-market expense of $70 million in 2011, versus a mark-to-market expense of $3 million in 2010. The
change in unrealized gains/losses on hedging activities decreased operating income by $92 million, as we recognized
losses of $64 million in 2011, versus gains of $28 million in 2010. The impact of divestitures (including primarily the
Starbucks CPG business cessation and income from a transition services agreement related to the Frozen Pizza
business) decreased operating income $162 million.
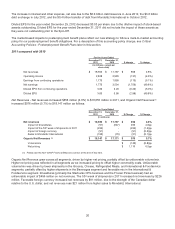
Net Earnings and Diluted EPS - Net earnings of $1,775 million decreased by $1,759 million (49.8%) in 2011. Diluted EPS
from continuing operations were $3.00 in 2011, down 6.0% from $3.20 in 2010. Diluted EPS were $3.00 in 2011, down
49.8% from $5.98 in 2010, due to the following:
Diluted EPS
Diluted EPS for the Year Ended December 31, 2010 $ 5.98
Discontinued operations 2.78
Diluted EPS from Continuing Operations for the Year Ended December 31, 2010 3.20
Increases in operations 0.14
Change in foreign currency 0.02
Impact of the 53rd week of shipments in 2011 0.07
Market-based impacts to postemployment benefit plans (0.08)
Change in unrealized gains/losses on hedging activities (0.10)
Impact of divestitures (0.20)
Royalty income from Mondele¯z International 0.01
Changes in taxes (0.06)
Diluted EPS for the Year Ended December 31, 2011 $ 3.00
The market-based impacts to postemployment benefit plans reflect our new strategy to follow a mark-to-market accounting
policy for our postemployment benefit obligations.
27