Kraft 2012 Annual Report Download - page 27
Download and view the complete annual report
Please find page 27 of the 2012 Kraft annual report below. You can navigate through the pages in the report by either clicking on the pages listed below, or by using the keyword search tool below to find specific information within the annual report.-
 1
1 -
2
-
3
-
4
-
5
-
6
-
7
-
8
-
9
-
10
-
11
-
12
-
13
-
14
-
15
-
16
-
 17
17 -
 18
18 -
 19
19 -
 20
20 -
 21
21 -
 22
22 -
 23
23 -
 24
24 -
 25
25 -
 26
26 -
 27
27 -
 28
28 -
 29
29 -
 30
30 -
 31
31 -
 32
32 -
 33
33 -
 34
34 -
 35
35 -
 36
36 -
 37
37 -
38
-
39
-
40
-
41
-
42
-
43
-
44
-
45
-
46
-
47
-
48
-
49
-
50
-
51
-
52
-
53
-
54
-
55
-
56
-
57
-
58
-
59
-
60
-
61
-
62
-
63
-
64
-
65
-
66
-
67
-
68
-
69
-
70
-
71
-
72
-
73
-
74
-
75
-
76
-
77
-
78
-
79
-
80
-
81
-
82
-
83
-
84
-
85
-
86
-
87
-
88
-
89
-
90
-
91
-
92
-
93
-
94
-
95
-
96
-
97
 |
 |

Organic Net Revenues increased slightly as the impact of higher net pricing was generally offset by unfavorable volume/
mix. Higher net pricing, including the impact of pricing from prior periods, was realized across all reportable business
segments as we increased pricing to offset higher commodity costs. Unfavorable volume/mix reflected lower shipments
(including a detriment of approximately 0.9 pp due to product pruning and 0.7 pp due to customer trade inventory
reductions). Sales to Mondele¯z International increased net revenues by $14 million while unfavorable foreign currency
lowered net revenues by $22 million, due to the strength of the U.S. dollar versus the Canadian dollar. In 2011, net
revenues included a 53rd week of shipments that added $226 million to net revenues and $91 million related to the impact
of divestitures (including for reporting purposes the Starbucks CPG business).
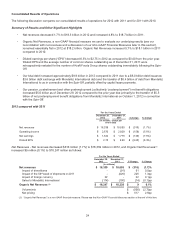
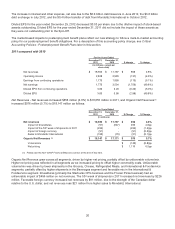
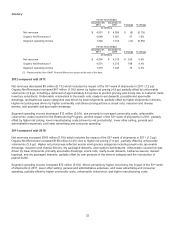
Operating Income - Operating income decreased $158 million (5.6%) to $2,670 million in 2012, due to the following:
Operating
Income Change
(in millions) (percentage point)
Operating Income for the Year Ended December 31, 2011 $ 2,828
Higher net pricing 517 18.4pp
Higher product costs (42) (1.5)pp
Unfavorable volume/mix (220) (7.8)pp
Lower selling, general and administrative expenses 51 1.8pp
Unfavorable foreign currency (5) (0.2)pp
Impact of the 53rd week of shipments in 2011 (62) (2.4)pp
Restructuring Program costs (303) (10.3)pp
Change in market-based impacts to postemployment benefit plans (153) (5.5)pp
Change in unrealized gains/losses on hedging activities 77 2.7pp
Decreased operating income from divestitures (20) (0.8)pp
Other, net 2-
Operating Income for the Year Ended December 29, 2012 $ 2,670 (5.6)%
Higher net pricing outpaced increased product costs during 2012. The increase in product costs was due to higher
commodity costs, partially offset by lower manufacturing costs (driven by net productivity). Unfavorable volume/mix was
reported in all segments, reflecting product pruning, customer trade inventory reductions, and the impact of higher pricing.
Despite an increase in advertising expense, total selling, general and administrative expenses decreased $51 million in
2012 from 2011 excluding Restructuring Program costs and the impacts of foreign currency, divestitures, and the 53rd
week of shipments in 2011. Unfavorable foreign currency decreased operating income by $5 million, due to the strength of
the U.S. dollar versus the Canadian dollar. The 53rd week of shipments in 2011 had an unfavorable year-over-year impact
of $62 million. We recorded Restructuring Program costs of $303 million in 2012, consisting of restructuring charges of
$141 million, implementation costs of $131 million, and Spin-Off transition costs of $31 million. The change in market-
based impacts to postemployment benefit plans decreased operating income by $153 million, as we recorded a mark-to-
market expense of $223 million in 2012 (which consists of a $594 million impact from changes in actuarial assumptions,
partially offset by $371 million of gains on pension assets), versus a mark-to-market expense of $70 million in 2011. The
change in unrealized gains/losses on hedging activities increased operating income by $77 million, as we recognized
gains of $13 million in 2012, versus losses of $64 million in 2011. The impact of divestitures (primarily the Starbucks CPG
business cessation) decreased operating income by $20 million.
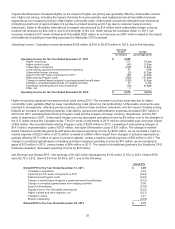
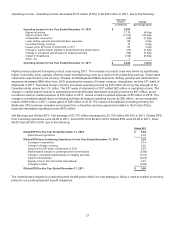
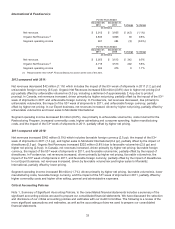
Net Earnings and Diluted EPS - Net earnings of $1,642 million decreased by $133 million (7.5%) in 2012. Diluted EPS
were $2.75 in 2012, down 8.3% from $3.00 in 2011, due to the following:
Diluted EPS
Diluted EPS for the Year Ended December 31, 2011 $ 3.00
Increases in operations 0.33
Impact of the 53rd week of shipments in 2011 (0.07)
Restructuring Program costs (0.32)
Change in market-based impacts to postemployment benefit plans (0.15)
Change in unrealized gains/losses from hedging activities 0.08
Impact of divestitures (0.02)
Royalty income from Mondele¯z International (0.01)
Higher interest and other expense, net (0.27)
Changes in taxes 0.21
Shares outstanding (0.03)
Diluted EPS for the Year Ended December 29, 2012 $ 2.75
25