Kraft 2012 Annual Report Download - page 78
Download and view the complete annual report
Please find page 78 of the 2012 Kraft annual report below. You can navigate through the pages in the report by either clicking on the pages listed below, or by using the keyword search tool below to find specific information within the annual report.-
 1
1 -
2
-
3
-
4
-
5
-
6
-
7
-
8
-
9
-
10
-
11
-
12
-
13
-
14
-
15
-
16
-
17
-
18
-
19
-
20
-
21
-
22
-
23
-
24
-
25
-
26
-
27
-
28
-
29
-
30
-
31
-
32
-
33
-
34
-
35
-
36
-
37
-
38
-
39
-
40
-
41
-
42
-
43
-
44
-
45
-
46
-
47
-
48
-
49
-
50
-
51
-
52
-
53
-
54
-
55
-
56
-
57
-
58
-
59
-
60
-
61
-
62
-
63
-
64
-
65
-
66
-
67
-
 68
68 -
 69
69 -
 70
70 -
 71
71 -
 72
72 -
 73
73 -
 74
74 -
 75
75 -
 76
76 -
 77
77 -
 78
78 -
 79
79 -
 80
80 -
 81
81 -
 82
82 -
 83
83 -
 84
84 -
 85
85 -
 86
86 -
 87
87 -
 88
88 -
89
-
90
-
91
-
92
-
93
-
94
-
95
-
96
-
97
 |
 |

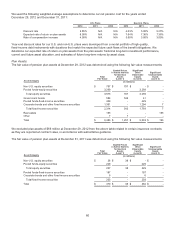
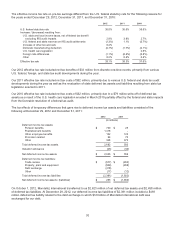
The effective income tax rate on pre-tax earnings differed from the U.S. federal statutory rate for the following reasons for
the years ended December 29, 2012, December 31, 2011, and December 31, 2010:
2012 2011 2010
U.S. federal statutory rate 35.0% 35.0% 35.0%
Increase / (decrease) resulting from:
U.S. state and local income taxes, net of federal tax benefit
excluding IRS audit impacts 2.8% 3.9% 2.7%
U.S. federal and state reserves on IRS audit settlements (1.3%) 1.1% (0.7%)
Increase of other tax accruals 0.2% - -
Domestic manufacturing deduction (2.7%) (1.7%) (2.1%)
U.S. health care legislation - - 2.6%
Foreign rate differences (1.1%) (0.3%) (0.8%)
Other 0.2% 0.3% 0.3%
Effective tax rate 33.1% 38.3% 37.0%
Our 2012 effective tax rate included net tax benefits of $33 million from discrete one-time events, primarily from various
U.S. federal, foreign, and state tax audit developments during the year.
Our 2011 effective tax rate included net tax costs of $52 million, primarily due to various U.S. federal and state tax audit
developments during the year as well as the revaluation of state deferred tax assets and liabilities resulting from state tax
legislation enacted in 2011.
Our 2010 effective tax rate included net tax costs of $32 million, primarily due to a $79 million write-off of deferred tax
assets as a result of the U.S. health care legislation enacted in March 2010 partially offset by the federal and state impacts
from the favorable resolution of a federal tax audit.
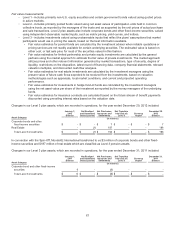
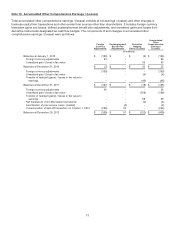
The tax effects of temporary differences that gave rise to deferred income tax assets and liabilities consisted of the
following at December 29, 2012 and December 31, 2011:
2012 2011
(in millions)
Deferred income tax assets:
Pension benefits $ 730 $ 25
Postretirement benefits 1,418 -
Other employee benefits 102 126
Promotion related 94 70
Other 348 372
Total deferred income tax assets 2,692 593
Valuation allowance (26) (34)
Net deferred income tax assets $ 2,666 $ 559
Deferred income tax liabilities:
Trade names $ (977) $ (952)
Property, plant and equipment (969) (958)
Debt exchange (418) -
Other (17) (12)
Total deferred income tax liabilities (2,381) (1,922)
Net deferred income tax assets / (liabilities) $ 285 $ (1,363)
On October 1, 2012, Mondele¯ z International transferred to us $2,623 million of net deferred tax assets and $2,458 million
of deferred tax liabilities. At December 29, 2012, our deferred income tax liabilities of $2,381 million included a $418
million deferred tax liability related to the debt exchange in which $3.6 billion of Mondele¯ z International debt was
exchanged for our debt.
76