Kraft 2012 Annual Report Download - page 28
Download and view the complete annual report
Please find page 28 of the 2012 Kraft annual report below. You can navigate through the pages in the report by either clicking on the pages listed below, or by using the keyword search tool below to find specific information within the annual report.-
 1
1 -
2
-
3
-
4
-
5
-
6
-
7
-
8
-
9
-
10
-
11
-
12
-
13
-
14
-
15
-
16
-
17
-
 18
18 -
 19
19 -
 20
20 -
 21
21 -
 22
22 -
 23
23 -
 24
24 -
 25
25 -
 26
26 -
 27
27 -
 28
28 -
 29
29 -
 30
30 -
 31
31 -
 32
32 -
 33
33 -
 34
34 -
 35
35 -
 36
36 -
 37
37 -
 38
38 -
39
-
40
-
41
-
42
-
43
-
44
-
45
-
46
-
47
-
48
-
49
-
50
-
51
-
52
-
53
-
54
-
55
-
56
-
57
-
58
-
59
-
60
-
61
-
62
-
63
-
64
-
65
-
66
-
67
-
68
-
69
-
70
-
71
-
72
-
73
-
74
-
75
-
76
-
77
-
78
-
79
-
80
-
81
-
82
-
83
-
84
-
85
-
86
-
87
-
88
-
89
-
90
-
91
-
92
-
93
-
94
-
95
-
96
-
97
 |
 |

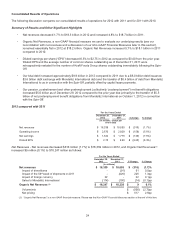
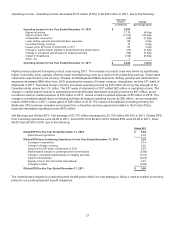
The increase in interest and other expense, net was due to the $6.0 billion debt issuance in June 2012, the $3.6 billion
debt exchange in July 2012, and the $0.4 billion transfer of debt from Mondele¯z International in October 2012.
Diluted EPS for the year ended December 29, 2012 decreased $0.03 per share due to the dilutive impact of stock-based
awards outstanding. Diluted EPS for the year ended December 31, 2011 did not include the impact of these awards as
they were not outstanding prior to the Spin-Off.
The market-based impacts to postemployment benefit plans reflect our new strategy to follow a mark-to-market accounting
policy for our postemployment benefit obligations. For a description of this accounting policy change, see Critical
Accounting Policies - Postemployment Benefit Plans later in this section.
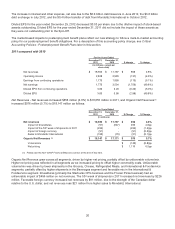
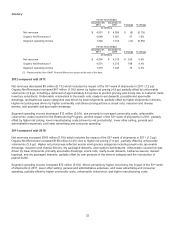
2011 compared with 2010
For the Years Ended
December 31,
2011
December 31,
2010 $ change % change
(in millions, except per
share data)
Net revenues $ 18,655 $ 17,797 $ 858 4.8%
Operating income 2,828 2,965 (137) (4.6%)
Earnings from continuing operations 1,775 1,890 (115) (6.1%)
Net earnings 1,775 3,534 (1,759) (49.8%)
Diluted EPS from continuing operations 3.00 3.20 (0.20) (6.0%)
Diluted EPS 3.00 5.98 (2.98) (49.8%)
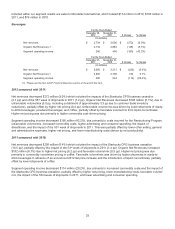
Net Revenues - Net revenues increased $858 million (4.8%) to $18,655 million in 2011, and Organic Net Revenues(1)
increased $976 million (5.7%) to $18,147 million as follows:
For the Years Ended
December 31,
2011
December 31,
2010 $ Change % Change
(in millions)
Net revenues $ 18,655 $ 17,797 $ 858 4.8%
Impact of divestitures (91) (547) 456 2.8pp
Impact of the 53rd week of shipments in 2011 (226) - (226) (1.3)pp
Impact of foreign currency (91) - (91) (0.5)pp
Sales to Mondele¯ z International (100) (79) (21) (0.1)pp
Organic Net Revenues (1) $ 18,147 $ 17,171 $ 976 5.7%
Volume/mix $ (140) (0.8)pp
Net pricing $ 1,116 6.5pp
(1) Please see the Non-GAAP Financial Measures section at the end of this item.
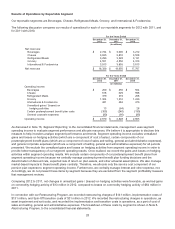
Organic Net Revenue grew across all segments, driven by higher net pricing, partially offset by unfavorable volume/mix.
Higher net pricing was reflected in all segments as we increased pricing to offset higher commodity costs. Unfavorable
volume/mix was driven by lower shipments in the Grocery, Cheese, Refrigerated Meals, and International & Foodservice
segments, partially offset by higher shipments in the Beverages segment and favorable mix in the International &
Foodservice segment. Divestitures (primarily the Starbucks CPG business and the Frozen Pizza business) had an
unfavorable impact of $456 million on net revenues. The 53rd week of shipments in 2011 increased net revenues by $226
million. Favorable foreign currency increased net revenues by $91 million, due to the strength of the Canadian dollar
relative to the U.S. dollar, and net revenues rose $21 million from higher sales to Mondele¯ z International.
26