Kraft 2012 Annual Report Download - page 70
Download and view the complete annual report
Please find page 70 of the 2012 Kraft annual report below. You can navigate through the pages in the report by either clicking on the pages listed below, or by using the keyword search tool below to find specific information within the annual report.-
 1
1 -
2
-
3
-
4
-
5
-
6
-
7
-
8
-
9
-
10
-
11
-
12
-
13
-
14
-
15
-
16
-
17
-
18
-
19
-
20
-
21
-
22
-
23
-
24
-
25
-
26
-
27
-
28
-
29
-
30
-
31
-
32
-
33
-
34
-
35
-
36
-
37
-
38
-
39
-
40
-
41
-
42
-
43
-
44
-
45
-
46
-
47
-
48
-
49
-
50
-
51
-
52
-
53
-
54
-
55
-
56
-
57
-
58
-
59
-
 60
60 -
 61
61 -
 62
62 -
 63
63 -
 64
64 -
 65
65 -
 66
66 -
 67
67 -
 68
68 -
 69
69 -
 70
70 -
 71
71 -
 72
72 -
 73
73 -
 74
74 -
 75
75 -
 76
76 -
 77
77 -
 78
78 -
 79
79 -
 80
80 -
81
-
82
-
83
-
84
-
85
-
86
-
87
-
88
-
89
-
90
-
91
-
92
-
93
-
94
-
95
-
96
-
97
 |
 |

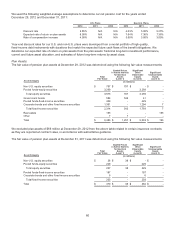
The percentage of fair value of pension plan assets at December 29, 2012 and December 31, 2011 was:
U.S. Plans Non-U.S. Plans
Asset Category 2012 2011 2012 2011
Equity securities 61% N/A 64% 57%
Fixed-income securities 36% N/A 35% 43%
Real estate 3% N/A - -
Other - N/A 1% -
Total 100% N/A 100% 100%
During 2013, we expect to begin a new liability-driven investment strategy. This strategy, which will be phased in over the
next several years, better aligns our pension assets with the projected benefit obligation to reduce volatility by investing
approximately 80% of our plan assets in fixed-income securities and approximately 20% in equity securities.
As of December 29, 2012, approximately 36% of our U.S. plan assets are in fixed-income securities and approximately
61% are in equity securities. The strategy uses actively managed and indexed U.S. investment grade fixed-income
securities (which constitute 95% or more of fixed-income securities) with lesser allocations to high yield fixed-income
securities, indexed U.S. equity securities, and actively managed and indexed international equity securities.
For the plans outside the U.S., the investment strategy is subject to local regulations and the asset / liability profiles of the
plans in each individual country. In aggregate, the asset allocation targets of our non-U.S. plans are broadly characterized
as a mix of 70% equity securities and 30% fixed-income securities. The other asset balance of our non-U.S. plans at
December 29, 2012 primarily related to $7 million in cash accounts.
We attempt to maintain our target asset allocation by rebalancing between asset classes as we make contributions and
monthly benefit payments.
Employer Contributions:
In order to align cash flows with expenses and reduce volatility, we have executed a level funding strategy. For our U.S.
qualified pension plans, in 2013, we are currently only required to make a nominal cash contribution under the Pension
Protection Act of 2006. However, based our level funding strategy, we estimate that 2013 pension contributions will be
approximately $420 million to our U.S. plans and approximately $205 million to our non-U.S. plans. We expect to
contribute approximately $225 million annually in 2014 and thereafter. Of the total 2013 pension contributions,
approximately $540 million is expected to be voluntary. Our actual contributions may be different due to many factors,
including changes in tax and other benefit laws, significant differences between expected and actual pension asset
performance or interest rates, or other factors. In 2012, we contributed $7 million to our U.S. pension plans and $35 million
to our non-U.S. pension plans. We did not make any voluntary contributions to our pension plans in 2012. We make
contributions to our U.S. and non-U.S. pension plans, primarily, to the extent that they are tax deductible. In addition,
employees contributed $3 million to our non-U.S. plans.
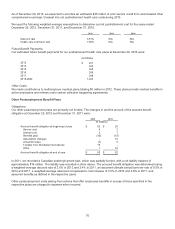
Future Benefit Payments:
The estimated future benefit payments from our pension plans at December 29, 2012 were:
U.S. Plans Non-U.S. Plans
(in millions)
2013 $ 445 $ 75
2014 448 75
2015 459 75
2016 467 75
2017 476 75
2018-2022 2,474 380
Other Costs:
Subsequent to the Spin-Off, we made contributions to multiemployer pension plans of $1 million in 2012. These plans
provide pension benefits to retirees under certain collective bargaining agreements. We also sponsor and contribute to
employee savings plans. These plans cover eligible salaried, non-union, and union employees. Our contributions and
costs are determined by the matching of employee contributions, as defined by the plans. Amounts charged to expense for
defined contribution plans totaled $12 million in 2012 subsequent to the Spin-Off.
68