Kraft 2012 Annual Report Download - page 51
Download and view the complete annual report
Please find page 51 of the 2012 Kraft annual report below. You can navigate through the pages in the report by either clicking on the pages listed below, or by using the keyword search tool below to find specific information within the annual report.-
 1
1 -
2
-
3
-
4
-
5
-
6
-
7
-
8
-
9
-
10
-
11
-
12
-
13
-
14
-
15
-
16
-
17
-
18
-
19
-
20
-
21
-
22
-
23
-
24
-
25
-
26
-
27
-
28
-
29
-
30
-
31
-
32
-
33
-
34
-
35
-
36
-
37
-
38
-
39
-
40
-
 41
41 -
 42
42 -
 43
43 -
 44
44 -
 45
45 -
 46
46 -
 47
47 -
 48
48 -
 49
49 -
 50
50 -
 51
51 -
 52
52 -
 53
53 -
 54
54 -
 55
55 -
 56
56 -
 57
57 -
 58
58 -
 59
59 -
 60
60 -
 61
61 -
62
-
63
-
64
-
65
-
66
-
67
-
68
-
69
-
70
-
71
-
72
-
73
-
74
-
75
-
76
-
77
-
78
-
79
-
80
-
81
-
82
-
83
-
84
-
85
-
86
-
87
-
88
-
89
-
90
-
91
-
92
-
93
-
94
-
95
-
96
-
97
 |
 |

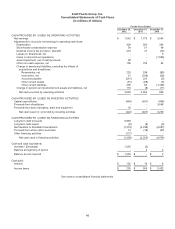
Kraft Foods Group, Inc.
Consolidated Statements of Cash Flows
(in millions of dollars)
For the Years Ended
December 29,
2012
December 31,
2011
December 31,
2010
CASH PROVIDED BY / (USED IN) OPERATING ACTIVITIES
Net earnings $ 1,642 $ 1,775 $ 3,534
Adjustments to reconcile net earnings to operating cash flows:
Depreciation 428 364 354
Stock-based compensation expense 54 51 49
Deferred income tax provision / (benefit) 470 41 (74)
Losses on divestitures, net --6
Gains on discontinued operations - - (1,596)
Asset impairment, net of cash proceeds 28 - -
Other non-cash expense, net 159 150 54
Change in assets and liabilities, excluding the effects of
acquisitions and divestitures:
Receivables, net 220 238 (80)
Inventories, net 21 (169) (69)
Accounts payable (241) 226 (5)
Other current assets (61) (88) (5)
Other current liabilities 205 84 (1,329)
Change in pension and postretirement assets and liabilities, net 110 (8) (11)
Net cash provided by operating activities 3,035 2,664 828
CASH PROVIDED BY / (USED IN) INVESTING ACTIVITIES
Capital expenditures (440) (401) (448)
Proceeds from divestitures - - 3,698
Proceeds from sale of property, plant and equipment 18 - -
Net cash (used in) / provided by investing activities (422) (401) 3,250
CASH PROVIDED BY / (USED IN) FINANCING ACTIVITIES
Long-term debt proceeds 5,963 - -
Long-term debt repaid (8) (9) (9)
Net transfers to Mondele¯z International (7,210) (2,238) (4,037)
Proceeds from stock option exercises 14 (18) (32)
Other financing activities (117) - -
Net cash used in financing activities (1,358) (2,265) (4,078)
Cash and cash equivalents:
Increase / (Decrease) 1,255 (2) -
Balance at beginning of period -22
Balance at end of period $ 1,255 $ - $ 2
Cash paid:
Interest $ 152 $ 10 $ 8
Income taxes $ 236 $ 959 $ 2,452
See notes to consolidated financial statements.
49