Kraft 2012 Annual Report Download - page 35
Download and view the complete annual report
Please find page 35 of the 2012 Kraft annual report below. You can navigate through the pages in the report by either clicking on the pages listed below, or by using the keyword search tool below to find specific information within the annual report.-
 1
1 -
2
-
3
-
4
-
5
-
6
-
7
-
8
-
9
-
10
-
11
-
12
-
13
-
14
-
15
-
16
-
17
-
18
-
19
-
20
-
21
-
22
-
23
-
24
-
 25
25 -
 26
26 -
 27
27 -
 28
28 -
 29
29 -
 30
30 -
 31
31 -
 32
32 -
 33
33 -
 34
34 -
 35
35 -
 36
36 -
 37
37 -
 38
38 -
 39
39 -
 40
40 -
 41
41 -
 42
42 -
 43
43 -
 44
44 -
 45
45 -
46
-
47
-
48
-
49
-
50
-
51
-
52
-
53
-
54
-
55
-
56
-
57
-
58
-
59
-
60
-
61
-
62
-
63
-
64
-
65
-
66
-
67
-
68
-
69
-
70
-
71
-
72
-
73
-
74
-
75
-
76
-
77
-
78
-
79
-
80
-
81
-
82
-
83
-
84
-
85
-
86
-
87
-
88
-
89
-
90
-
91
-
92
-
93
-
94
-
95
-
96
-
97
 |
 |

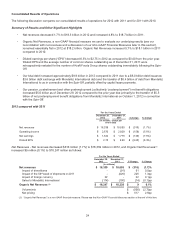
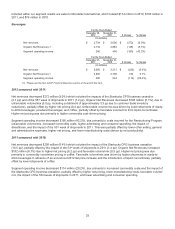
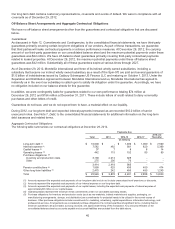
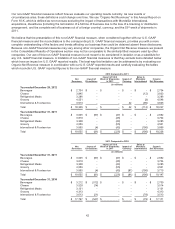
International & Foodservice
For the Years Ended
December 29,
2012
December 31,
2011 $ change % change
(in millions)
Net revenues $ 3,913 $ 3,955 $ (42) (1.1%)
Organic Net Revenues (1) 3,836 3,806 30 0.8%
Segment operating income 481 484 (3) (0.6%)
For the Years Ended
December 31,
2011
December 31,
2010 $ change % change
(in millions)
Net revenues $ 3,955 $ 3,613 $ 342 9.5%
Organic Net Revenues (1) 3,715 3,513 202 5.8%
Segment operating income 484 476 8 1.7%
(1) Please see the Non-GAAP Financial Measures section at the end of this item.
2012 compared with 2011:
Net revenues decreased $42 million (1.1%) which includes the impact of the 53rd week of shipments in 2011 (1.2 pp) and
unfavorable foreign currency (0.5 pp). Organic Net Revenues increased $30 million (0.8%) due to higher net pricing (3.8
pp) partially offset by unfavorable volume/mix (3.0 pp, including a detriment of approximately 2.4 pp due to product
pruning). In Canada, net revenues increased, driven primarily by higher net pricing, partially offset by the impact of the 53rd
week of shipments in 2011 and unfavorable foreign currency. In Foodservice, net revenues decreased, due primarily to
unfavorable volume/mix, the impact of the 53rd week of shipments in 2011, and unfavorable foreign currency, partially
offset by higher net pricing. In our Export business, net revenues increased, driven by higher net pricing, partially offset by
unfavorable volume/mix and lower sales to Mondele¯ z International.
Segment operating income decreased $3 million (0.6%), due primarily to unfavorable volume/mix, costs incurred for the
Restructuring Program, increased commodity costs, higher advertising and consumer spending, higher manufacturing
costs, and the impact of the 53rd week of shipments in 2011, partially offset by higher net pricing.
2011 compared with 2010:
Net revenues increased $342 million (9.5%) which includes favorable foreign currency (2.5 pp), the impact of the 53rd
week of shipments in 2011 (1.3 pp), and higher sales to Mondele¯ z International (0.4 pp), partially offset by the impact of
divestitures (0.5 pp). Organic Net Revenues increased $202 million (5.8%) due to favorable volume/mix (2.9 pp) and
higher net pricing (2.9 pp). In Canada, net revenues increased, driven primarily by higher net pricing, favorable foreign
currency, the impact of the 53rd week of shipments in 2011, and favorable volume/mix, partially offset by the impact of
divestitures. In Foodservice, net revenues increased, driven primarily by higher net pricing, favorable volume/mix, the
impact of the 53rd week of shipments in 2011, and favorable foreign currency, partially offset by the impact of divestitures.
In our Export business, net revenues increased, driven by favorable volume/mix and higher sales to Mondele¯z
International, partially offset by lower pricing.
Segment operating income increased $8 million (1.7%), driven primarily by higher net pricing, favorable volume/mix, lower
manufacturing costs, favorable foreign currency, and the impact of the 53rd week of shipments in 2011, partially offset by
higher commodity costs and higher other selling, general and administrative expenses.
Critical Accounting Policies
Note 1, Summary of Significant Accounting Policies, to the consolidated financial statements includes a summary of the
significant accounting policies we used to prepare our consolidated financial statements. We have discussed the selection
and disclosure of our critical accounting policies and estimates with our Audit Committee. The following is a review of the
more significant assumptions and estimates, as well as the accounting policies we used to prepare our consolidated
financial statements.
33