Kraft 2012 Annual Report Download - page 26
Download and view the complete annual report
Please find page 26 of the 2012 Kraft annual report below. You can navigate through the pages in the report by either clicking on the pages listed below, or by using the keyword search tool below to find specific information within the annual report.-
 1
1 -
2
-
3
-
4
-
5
-
6
-
7
-
8
-
9
-
10
-
11
-
12
-
13
-
14
-
15
-
 16
16 -
 17
17 -
 18
18 -
 19
19 -
 20
20 -
 21
21 -
 22
22 -
 23
23 -
 24
24 -
 25
25 -
 26
26 -
 27
27 -
 28
28 -
 29
29 -
 30
30 -
 31
31 -
 32
32 -
 33
33 -
 34
34 -
 35
35 -
 36
36 -
37
-
38
-
39
-
40
-
41
-
42
-
43
-
44
-
45
-
46
-
47
-
48
-
49
-
50
-
51
-
52
-
53
-
54
-
55
-
56
-
57
-
58
-
59
-
60
-
61
-
62
-
63
-
64
-
65
-
66
-
67
-
68
-
69
-
70
-
71
-
72
-
73
-
74
-
75
-
76
-
77
-
78
-
79
-
80
-
81
-
82
-
83
-
84
-
85
-
86
-
87
-
88
-
89
-
90
-
91
-
92
-
93
-
94
-
95
-
96
-
97
 |
 |

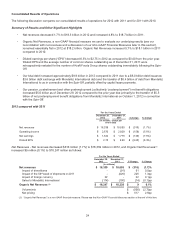
Consolidated Results of Operations
The following discussion compares our consolidated results of operations for 2012 with 2011 and for 2011 with 2010.
Summary of Results and Other Significant Highlights
• Net revenues decreased 1.7% to $18.3 billion in 2012 and increased 4.8% to $18.7 billion in 2011.
• Organic Net Revenues, a non-GAAP financial measure we use to evaluate our underlying results (see our
reconciliation with net revenues and a discussion of our Non-GAAP Financial Measures later in this section),
remained essentially flat in 2012 at $18.2 billion. Organic Net Revenues increased 5.7% to $18.1 billion in 2011
compared to 2010.
• Diluted earnings per share (“EPS”) decreased 8.3% to $2.75 in 2012 as compared to $3.00 from the prior year.
Diluted EPS and the average number of common shares outstanding as of December 31, 2011 were
retrospectively restated for the number of Kraft Foods Group shares outstanding immediately following the Spin-
Off.
• Our total debt increased approximately $9.9 billion in 2012 compared to 2011 due to a $6.0 billion debt issuance,
$3.6 billion debt exchange with Mondele¯z International debt and the transfer of $0.4 billion of debt from Mondele¯z
International to us in connection with the Spin-Off, partially offset by capital lease payments.
• Our pension, postretirement and other postemployment (collectively “postemployment”) net benefit obligations
increased $5.6 billion as of December 29, 2012 compared to the prior year due primarily to the transfer of $5.5
billion of net postemployment benefit obligations from Mondele¯z International on October 1, 2012 in connection
with the Spin-Off.
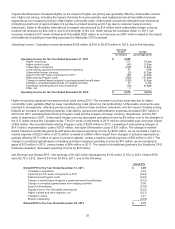
2012 compared with 2011
For the Years Ended
December 29,
2012
December 31,
2011 $ change % change
(in millions, except per
share data)
Net revenues $ 18,339 $ 18,655 $ (316) (1.7%)
Operating income $ 2,670 $ 2,828 $ (158) (5.6%)
Net earnings $ 1,642 $ 1,775 $ (133) (7.5%)
Diluted EPS $ 2.75 $ 3.00 $ (0.25) (8.3%)
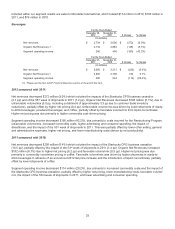
Net Revenues - Net revenues decreased $316 million (1.7%) to $18,339 million in 2012, and Organic Net Revenues(1)
increased $9 million (0.1%) to $18,247 million as follows:
For the Years Ended
December 29,
2012
December 31,
2011 $ Change % Change
(in millions)
Net revenues $ 18,339 $ 18,655 $ (316) (1.7)%
Impact of divestitures - (91) 91 0.5pp
Impact of the 53rd week of shipments in 2011 - (226) 226 1.3pp
Impact of foreign currency 22 - 22 0.1pp
Sales to Mondele¯z International (114) (100) (14) (0.1)pp
Organic Net Revenues (1) $ 18,247 $ 18,238 $ 9 0.1%
Volume/mix $ (508) (2.7)pp
Net pricing $ 517 2.8pp
(1) “Organic Net Revenues” is a non-GAAP financial measure. Please see the Non-GAAP Financial Measures section at the end of this item.
24