Kraft 2012 Annual Report Download - page 69
Download and view the complete annual report
Please find page 69 of the 2012 Kraft annual report below. You can navigate through the pages in the report by either clicking on the pages listed below, or by using the keyword search tool below to find specific information within the annual report.-
 1
1 -
2
-
3
-
4
-
5
-
6
-
7
-
8
-
9
-
10
-
11
-
12
-
13
-
14
-
15
-
16
-
17
-
18
-
19
-
20
-
21
-
22
-
23
-
24
-
25
-
26
-
27
-
28
-
29
-
30
-
31
-
32
-
33
-
34
-
35
-
36
-
37
-
38
-
39
-
40
-
41
-
42
-
43
-
44
-
45
-
46
-
47
-
48
-
49
-
50
-
51
-
52
-
53
-
54
-
55
-
56
-
57
-
58
-
 59
59 -
 60
60 -
 61
61 -
 62
62 -
 63
63 -
 64
64 -
 65
65 -
 66
66 -
 67
67 -
 68
68 -
 69
69 -
 70
70 -
 71
71 -
 72
72 -
 73
73 -
 74
74 -
 75
75 -
 76
76 -
 77
77 -
 78
78 -
 79
79 -
80
-
81
-
82
-
83
-
84
-
85
-
86
-
87
-
88
-
89
-
90
-
91
-
92
-
93
-
94
-
95
-
96
-
97
 |
 |

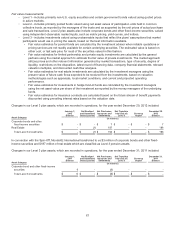
Fair value measurements:
• Level 1 - includes primarily non-U.S. equity securities and certain government bonds valued using quoted prices
in active markets.
• Level 2 - includes primarily pooled funds valued using net asset values of participation units held in common
collective trusts, as reported by the managers of the trusts and as supported by the unit prices of actual purchase
and sale transactions. Level 2 plan assets also include corporate bonds and other fixed-income securities, valued
using independent observable market inputs, such as matrix pricing, yield curves, and indices.
• Level 3 - includes investments valued using unobservable inputs that reflect the plans’ assumptions that market
participants would use in pricing the assets, based on the best information available.
• Fair value estimates for pooled funds are calculated by the investment advisor when reliable quotations or
pricing services are not readily available for certain underlying securities. The estimated value is based on
either cost, or last sale price for most of the securities valued in this fashion.
• Fair value estimates for limited partnership and private equity investments are calculated by the general
partners using the market approach to estimate the fair value of private investments. The market approach
utilizes prices and other relevant information generated by market transactions, type of security, degree of
liquidity, restrictions on the disposition, latest round of financing data, company financial statements, relevant
valuation multiples, and discounted cash flow analyses.
• Fair value estimates for real estate investments are calculated by the investment managers using the
present value of future cash flows expected to be received from the investments, based on valuation
methodologies such as appraisals, local market conditions, and current and projected operating
performance.
• Fair value estimates for investments in hedge fund-of-funds are calculated by the investment managers
using the net asset value per share of the investment as reported by the money managers of the underlying
funds.
• Fair value estimates for insurance contracts are calculated based on the future stream of benefit payments
discounted using prevailing interest rates based on the valuation date.
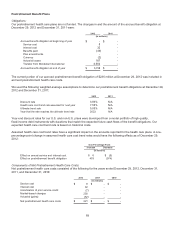
Changes in our Level 3 plan assets, which are recorded in operations, for the year ended December 29, 2012 included:
Asset Category
January 1,
2012
Balance
Net Realized
and Unrealized
Gains/(Losses)
Net Purchases,
Issuances and
Settlements
Net Transfers
Into/(Out of)
Level 3
Currency
Impact
December 29,
2012
Balance
(in millions)
Corporate bonds and other
fixed-income securities $ - $ - $ 7 $ - $ - $ 7
Real Estate - (1) 187 - - 186
Total Level 3 investments $ - $ (1) $ 194 $ - $ - $ 193
In connection with the Spin-Off, Mondele¯ z International transferred to us $3 million of corporate bonds and other fixed-
income securities and $187 million of real estate which are classified as Level 3 pension assets.
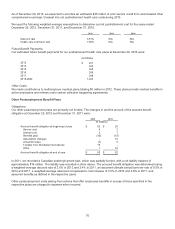
Changes in our Level 3 plan assets, which are recorded in operations, for the year ended December 31, 2011 included:
Asset Category
January 1,
2011
Balance
Net Realized
and Unrealized
Gains/(Losses)
Net Purchases,
Issuances and
Settlements
Net Transfers
Into/(Out of)
Level 3
Currency
Impact
December 31,
2011
Balance
(in millions)
Corporate bond and other fixed-income
securities 6 - (6) - - -
Total Level 3 investments $ 6$-$(6)$-$-$-
67