Kraft 2012 Annual Report Download - page 3
Download and view the complete annual report
Please find page 3 of the 2012 Kraft annual report below. You can navigate through the pages in the report by either clicking on the pages listed below, or by using the keyword search tool below to find specific information within the annual report.-
 1
1 -
 2
2 -
 3
3 -
 4
4 -
 5
5 -
 6
6 -
 7
7 -
 8
8 -
 9
9 -
 10
10 -
 11
11 -
 12
12 -
 13
13 -
 14
14 -
15
-
16
-
17
-
18
-
19
-
20
-
21
-
22
-
23
-
24
-
25
-
26
-
27
-
28
-
29
-
30
-
31
-
32
-
33
-
34
-
35
-
36
-
37
-
38
-
39
-
40
-
41
-
42
-
43
-
44
-
45
-
46
-
47
-
48
-
49
-
50
-
51
-
52
-
53
-
54
-
55
-
56
-
57
-
58
-
59
-
60
-
61
-
62
-
63
-
64
-
65
-
66
-
67
-
68
-
69
-
70
-
71
-
72
-
73
-
74
-
75
-
76
-
77
-
78
-
79
-
80
-
81
-
82
-
83
-
84
-
85
-
86
-
87
-
88
-
89
-
90
-
91
-
92
-
93
-
94
-
95
-
96
-
97
 |
 |
Forward-looking Statements
This report contains a number of forward-looking statements. Words such as “anticipate,” “estimate,” “expect,” “project,”
“intend,” “plan,” “continue,” “believe,” “may,” “will,” and variations of such words and similar expressions are intended to
identify our forward-looking statements. Examples of forward-looking statements include, but are not limited to,
statements, beliefs, and expectations regarding the Spin-Off and our business, dividends, the impact of new accounting
standards and accounting changes, commodity costs, costs incurred in connection with the Spin-Off (as defined below),
the Restructuring Program (as defined below), hedging activities, results of legal matters, our goodwill and other intangible
assets, price volatility and cost environment, our liquidity, our funding sources, our postemployment benefit plans,
including expected contributions, obligations, rates of return and costs, our capital expenditures and funding, our debt, off-
balance sheet arrangements and contractual obligations, general views about future operating results, our risk
management program, and other events or developments that we expect or anticipate will occur in the future.
These forward-looking statements are not guarantees of future performance and are subject to a number of risks and
uncertainties, many of which are beyond our control. The cautionary statements contained in the “Risk Factors” found in
this Annual Report on Form 10-K identify important factors that could cause actual results to differ materially from those in
our forward-looking statements. These factors include, but are not limited to, increased competition; our ability to
differentiate our products from retailer and economy brands; our ability to maintain our reputation and brand image;
increasing consolidation of retail customers; changes in relationships with our significant customers and suppliers;
continued volatility and sharp increases in commodity and other input costs; pricing actions; increased costs of sales;
product recalls and product liability claims; unanticipated business disruptions; our ability to predict, identify and interpret
changes in consumer preferences and demand; a shift in our product mix to lower margin offerings; unexpected safety or
manufacturing issues, regulatory or legal restrictions, actions or delays, unanticipated expenses such as litigation or legal
settlement expenses; our ability to complete potential divestitures or acquisitions; our ability to realize the expected
benefits of acquisitions if they are completed; our indebtedness and our ability to pay our indebtedness; disruptions in our
information technology networks and systems; our inability to protect our intellectual property rights; continued consumer
weakness; weakness in economic conditions; tax law changes; the qualification of the Distribution and the Internal Spin-
Off Transactions (each as defined below) for non-recognition treatment for U.S. federal income tax purposes (as well as
any related indemnification obligation to Mondele¯z International, Inc. (“Mondele¯z International,” formerly Kraft Foods Inc.)
in case such transactions do not so qualify); the qualification of the Canadian aspects of the Internal Spin-Off Transactions
for tax-deferred treatment for Canadian federal and provincial income tax purposes; the restrictions we agreed to in order
to preserve the non-recognition treatment of the Internal Spin-Off Transactions and the Distribution; our ability to achieve
the benefits we expect to achieve from the Spin-Off and to do so in a timely and cost-effective manner; our lack of
operating history as an independent, publicly traded company; future competition from Mondele¯z International; and the
incurrence of substantial indebtedness in connection with the Spin-Off and any potential related reductions in spending on
our business activities. We disclaim and do not undertake any obligation to update or revise any forward-looking statement
in this report, except as required by applicable law or regulation.
PART I
Item 1. Business.
General
Kraft Foods Group is one of the largest consumer packaged food and beverage companies in North America and one of
the largest worldwide among publicly traded consumer packaged food and beverage companies with net revenues of
$18.3 billion and earnings from continuing operations before income taxes of $2.5 billion in 2012. We manufacture and
market food and beverage products, including refrigerated meals, refreshment beverages and coffee, cheese, and other
grocery products, primarily in the United States and Canada, under a host of iconic brands. Our product categories span
breakfast, lunch, and dinner meal occasions, both at home and in foodservice locations. At December 29, 2012, we had
assets of $23.3 billion. We are a member of the Standard & Poor’s 500 Index.
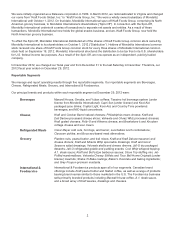
Our diverse brand portfolio consists of many of the most popular food brands in North America, including two brands with
annual net revenues exceeding $1 billion each - Kraft cheeses, dinners, and dressings and Oscar Mayer meats - plus over
25 brands with annual net revenues of between $100 million and $1 billion each. In the United States, based on dollar
share in 2012, we hold the number one branded market share position in 11 of our top 17 product categories and the
number two branded share position in the remaining six product categories. The 11 product categories with the number
one branded share position contributed more than 50% of our 2012 U.S. retail net revenues while our top 17 product
categories contributed more than 80% of our 2012 U.S. retail net revenues.
1