Kraft 2012 Annual Report Download - page 36
Download and view the complete annual report
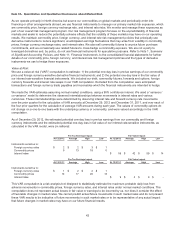
Please find page 36 of the 2012 Kraft annual report below. You can navigate through the pages in the report by either clicking on the pages listed below, or by using the keyword search tool below to find specific information within the annual report.Principles of Consolidation:
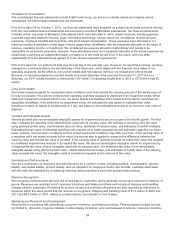
The consolidated financial statements include Kraft Foods Group, as well as our wholly owned and majority owned
subsidiaries. All intercompany transactions are eliminated.
Prior to the Spin-Off on October 1, 2012, our financial statements were prepared on a stand-alone basis and were derived
from the consolidated financial statements and accounting records of Mondele¯z International. Our financial statements
included certain expenses of Mondele¯z International which were allocated to us for certain functions, including general
corporate expenses related to finance, legal, information technology, human resources, compliance, shared services,
insurance, employee benefits and incentives, and stock-based compensation. These expenses were allocated in our
historical results of operations on the basis of direct usage when identifiable, with the remainder allocated on the basis of
revenue, operating income, or headcount. We considered the expense allocation methodology and results to be
reasonable for all periods presented. However, these allocations were not necessarily indicative of the actual expenses we
would have incurred as an independent public company or of the costs we will incur in the future, and may differ
substantially from the allocations we agreed to in the various separation agreements.
Prior to the Spin-Off, our period-end date was the last day of the calendar year. However, for reporting purposes, we have
changed our period-end date to the last Saturday of the fiscal year, which aligns with the financial close dates of our
operating segments. As the effect to prior period results was not material, we have not revised prior period results.
Because our operating segments reported results on the last Saturday of the year and December 31, 2011 fell on a
Saturday, our 2011 results included an extra week (“53rd week”) of operating results than in 2012 or 2010 which had 52
weeks.
Long-Lived Assets:
We review long-lived assets for impairment when conditions exist that indicate the carrying amount of the assets may not
be fully recoverable. We perform undiscounted operating cash flow analyses to determine if an impairment exists. When
testing for impairment of assets held for use, we group assets and liabilities at the lowest level for which cash flows are
separately identifiable. If we determine an impairment exists, we calculate the loss based on estimated fair value.
Impairment losses on assets to be disposed of, if any, are based on the estimated proceeds to be received, less costs of
disposal.
Goodwill and Intangible Assets:
We test goodwill and non-amortizable intangible assets for impairment at least once a year in the fourth quarter. The first
step compares the reporting unit’s estimated fair value with its carrying value. We estimate a reporting unit’s fair value
using planned growth rates, market-based discount rates, estimates of residual value, and estimates of market multiples.
Estimating the fair value of individual reporting units requires us to make assumptions and estimates regarding our future
plans, industry, and economic conditions and our actual results and conditions may differ over time. If the carrying value of
a reporting unit’s net assets exceeds its fair value, the second step is applied to measure the difference between the
carrying value and implied fair value of goodwill. If the carrying value of goodwill exceeds its implied fair value, the goodwill
is considered impaired and reduced to its implied fair value. We test non-amortizable intangible assets for impairment by
comparing the fair value of each intangible asset with its carrying value. We determine fair value of non-amortizable
intangible assets using planned growth rates, market-based discount rates, and estimates of royalty rates. If the carrying
value exceeds fair value, the intangible asset is considered impaired and is reduced to fair value.
Insurance and Self-Insurance:
We use a combination of insurance and self-insurance for a number of risks, including workers’ compensation, general
liability, automobile liability, product liability, and our obligation for employee health care benefits. Liabilities associated
with the risks are estimated by considering historical claims experience and other actuarial assumptions.
Revenue Recognition:
We recognize revenues when title and risk of loss pass to customers, which generally occurs upon shipment or delivery of
goods. Revenues are recorded net of consumer incentives and trade promotions and include all shipping and handling
charges billed to customers. Provisions for product returns and customer allowances are also recorded as reductions to
revenues within the same period that the revenue is recognized. Shipping and handling costs of $1.0 million in 2012 and
2011 and $0.9 million in 2010, related to product returns, are included in cost of sales.
Marketing and Research and Development:
We promote our products with advertising, consumer incentives, and trade promotions. These programs include, but are
not limited to, discounts, coupons, rebates, in-store display incentives, and volume-based incentives. Consumer incentive
34


