Kraft 2012 Annual Report Download - page 23
Download and view the complete annual report
Please find page 23 of the 2012 Kraft annual report below. You can navigate through the pages in the report by either clicking on the pages listed below, or by using the keyword search tool below to find specific information within the annual report.-
 1
1 -
2
-
3
-
4
-
5
-
6
-
7
-
8
-
9
-
10
-
11
-
12
-
 13
13 -
 14
14 -
 15
15 -
 16
16 -
 17
17 -
 18
18 -
 19
19 -
 20
20 -
 21
21 -
 22
22 -
 23
23 -
 24
24 -
 25
25 -
 26
26 -
 27
27 -
 28
28 -
 29
29 -
 30
30 -
 31
31 -
 32
32 -
 33
33 -
34
-
35
-
36
-
37
-
38
-
39
-
40
-
41
-
42
-
43
-
44
-
45
-
46
-
47
-
48
-
49
-
50
-
51
-
52
-
53
-
54
-
55
-
56
-
57
-
58
-
59
-
60
-
61
-
62
-
63
-
64
-
65
-
66
-
67
-
68
-
69
-
70
-
71
-
72
-
73
-
74
-
75
-
76
-
77
-
78
-
79
-
80
-
81
-
82
-
83
-
84
-
85
-
86
-
87
-
88
-
89
-
90
-
91
-
92
-
93
-
94
-
95
-
96
-
97
 |
 |

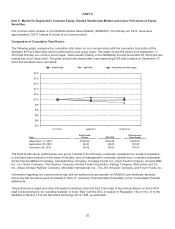
Issuer Purchases of Equity Securities during the Quarter ended December 29, 2012
There are currently no share repurchase programs authorized by our Board of Directors. The following activity represents
shares tendered by individuals who used shares to exercise options or to pay the related taxes for grants of restricted
stock, restricted stock units, and performance shares (as defined below) that vested. Accordingly, these are non-cash
transactions.
Total Number
of Shares
Average Price Paid
per Share
October 2012 11,621 $ 45.29
November 2012 3,056 44.66
December 2012 1,088 45.66
For the Quarter Ended December 29, 2012 15,765 45.19
Item 6. Selected Financial Data.
Kraft Foods Group, Inc.
Selected Financial Data—Five Year Review
December 29,
2012
December 31,
2011
December 31,
2010
December 31,
2009
December 31,
2008
(in millions of dollars, except per share data)
Year Ended:
Net revenues $ 18,339 $ 18,655 $ 17,797 $ 17,278 $ 17,708
Earnings from continuing operations 1,642 1,775 1,890 1,896 1,406
Earnings and gain from discontinued operations,
net of income taxes - - 1,644 218 1,209
Net earnings $ 1,642 $ 1,775 $ 3,534 $ 2,114 $ 2,615
Earnings from continuing operations per share (1):
Basic $ 2.77 $ 3.00 $ 3.20 $ 3.21 $ 2.38
Diluted $ 2.75 $ 3.00 $ 3.20 $ 3.21 $ 2.38
Net cash provided by operating activities $ 3,035 $ 2,664 $ 828 $ 3,017 $ 2,920
Capital expenditures 440 401 448 513 533
Depreciation 428 364 354 348 356
As of:
Total assets 23,329 21,539 21,598 22,189 22,052
Long-term debt 9,966 27 31 48 227
Total equity 3,572 16,588 17,037 17,511 17,296
Dividends declared per share $ 0.50 $ - $ - $ - $ -
(1) On October 1, 2012, Mondele¯z International distributed 592 million shares of Kraft Foods Group common stock to Mondele¯z International’s
shareholders. Basic and diluted earnings per common share and the average number of common shares outstanding were retrospectively restated for
the years ended December 31, 2011, December 31, 2010, December 31, 2009, and December 31, 2008 for the number of Kraft Foods Group shares
outstanding immediately following this transaction.
21