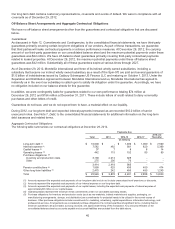
Kraft 2012 Annual Report Download - page 32
Download and view the complete annual report
Please find page 32 of the 2012 Kraft annual report below. You can navigate through the pages in the report by either clicking on the pages listed below, or by using the keyword search tool below to find specific information within the annual report.-
 1
1 -
2
-
3
-
4
-
5
-
6
-
7
-
8
-
9
-
10
-
11
-
12
-
13
-
14
-
15
-
16
-
17
-
18
-
19
-
20
-
21
-
 22
22 -
 23
23 -
 24
24 -
 25
25 -
 26
26 -
 27
27 -
 28
28 -
 29
29 -
 30
30 -
 31
31 -
 32
32 -
 33
33 -
 34
34 -
 35
35 -
 36
36 -
 37
37 -
 38
38 -
 39
39 -
 40
40 -
 41
41 -
 42
42 -
43
-
44
-
45
-
46
-
47
-
48
-
49
-
50
-
51
-
52
-
53
-
54
-
55
-
56
-
57
-
58
-
59
-
60
-
61
-
62
-
63
-
64
-
65
-
66
-
67
-
68
-
69
-
70
-
71
-
72
-
73
-
74
-
75
-
76
-
77
-
78
-
79
-
80
-
81
-
82
-
83
-
84
-
85
-
86
-
87
-
88
-
89
-
90
-
91
-
92
-
93
-
94
-
95
-
96
-
97
 |
 |

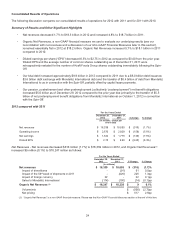
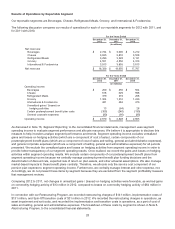
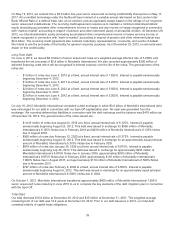
Cheese
For the Years Ended
December 29,
2012
December 31,
2011 $ change % change
(in millions)
Net revenues $ 3,845 $ 3,810 $ 35 0.9%
Organic Net Revenues (1) 3,833 3,764 69 1.8%
Segment operating income 618 629 (11) (1.7%)
For the Years Ended
December 31,
2011
December 31,
2010 $ change % change
(in millions)
Net revenues $ 3,810 $ 3,528 $ 282 8.0%
Organic Net Revenues (1) 3,764 3,514 250 7.1%
Segment operating income 629 598 31 5.2%
(1) Please see the Non-GAAP Financial Measures section at the end of this item.
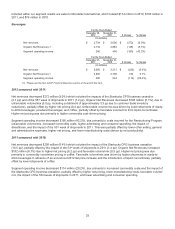
2012 compared with 2011:
Net revenues increased $35 million (0.9%) which includes the impact of higher sales to Mondele¯ z International (0.4 pp),
offset by the impact of the 53rd week of shipments in 2011 (1.3 pp). Organic Net Revenues increased $69 million (1.8%),
driven by higher net pricing (2.2 pp) partially offset by unfavorable volume/mix (0.4 pp, including a detriment of
approximately 1.2 pp due to product pruning). Higher net pricing was realized in the specialty, grated, recipe, and natural
cheese categories. Unfavorable volume/mix was due primarily to product pruning and lower shipments of grated cheese,
partially offset by favorable volume/mix in natural cheese driven by higher shipments.
Segment operating income decreased $11 million (1.7%), due primarily to costs incurred for the Restructuring Program,
higher advertising and consumer spending, and the impact of the 53rd week of shipments in 2011, partially offset by higher
net pricing, lower manufacturing costs (driven by net productivity), lower other selling, general and administrative
expenses, and lower commodity costs.
2011 compared with 2010:
Net revenues increased $282 million (8.0%) which includes the impact of the 53rd week of shipments in 2011 (1.3 pp),
partially offset by the impact of divestitures (0.4 pp). Organic Net Revenues increased $250 million (7.1%) driven by higher
net pricing (8.4 pp), partially offset by unfavorable volume/mix (1.3 pp). Higher net pricing, across most major cheese
categories, was due to commodity cost-driven pricing. Unfavorable volume/mix was driven primarily by lower shipments in
sandwich, cream cheese, and recipe cheese categories, partially offset by higher shipments in cultured, natural cheese,
and grated cheese categories.
Segment operating income increased $31 million (5.2%), due primarily to higher net pricing, lower other selling, general
and administrative expenses (including a termination fee received due to the restructuring of a service contract), lower
manufacturing costs, the impact of the 53rd week of shipments in 2011, and the 2010 loss on a divestiture, partially offset
by higher commodity costs (primarily higher dairy costs), unfavorable volume/mix, and higher advertising and consumer
spending.
30