Kraft 2012 Annual Report Download - page 39
Download and view the complete annual report
Please find page 39 of the 2012 Kraft annual report below. You can navigate through the pages in the report by either clicking on the pages listed below, or by using the keyword search tool below to find specific information within the annual report.-
 1
1 -
2
-
3
-
4
-
5
-
6
-
7
-
8
-
9
-
10
-
11
-
12
-
13
-
14
-
15
-
16
-
17
-
18
-
19
-
20
-
21
-
22
-
23
-
24
-
25
-
26
-
27
-
28
-
 29
29 -
 30
30 -
 31
31 -
 32
32 -
 33
33 -
 34
34 -
 35
35 -
 36
36 -
 37
37 -
 38
38 -
 39
39 -
 40
40 -
 41
41 -
 42
42 -
 43
43 -
 44
44 -
 45
45 -
 46
46 -
 47
47 -
 48
48 -
 49
49 -
50
-
51
-
52
-
53
-
54
-
55
-
56
-
57
-
58
-
59
-
60
-
61
-
62
-
63
-
64
-
65
-
66
-
67
-
68
-
69
-
70
-
71
-
72
-
73
-
74
-
75
-
76
-
77
-
78
-
79
-
80
-
81
-
82
-
83
-
84
-
85
-
86
-
87
-
88
-
89
-
90
-
91
-
92
-
93
-
94
-
95
-
96
-
97
 |
 |

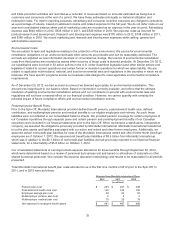
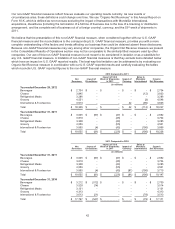
For our postretirement plans, our 2013 health care cost trend rate assumption will be 7.53%. We established this rate
based upon our most recent experience as well as our expectation for health care trend rates going forward. We anticipate
that our health care cost trend rate assumption will be 5.03% by 2023. Assumed health care cost trend rates have a
significant effect on the amounts reported for the health care plans. A one-percentage-point change in assumed health
care cost trend rates would have the following effects as of December 29, 2012:
One-Percentage-Point
Increase Decrease
(in millions)
Effect on annual service and interest cost $ 6 $ (5)
Effect on postretirement benefit obligation 453 (374)
Our 2013 discount rate assumption is 3.89% for our postretirement plans. Our 2013 discount rate is 4.05% for our U.S.
pension plans and 4.00% for our non-U.S. pension plans. We model these discount rates using a portfolio of high quality,
fixed-income debt instruments with durations that match the expected future cash flows of the benefit obligations. Changes
in our discount rates were primarily the result of changes in bond yields year-over-year.
Our 2013 expected rate of return on plan assets is 5.75% for our U.S. pension plans and 5.00% for our non-U.S. pension
plans. We determine our expected rate of return on plan assets from the plan assets’ historical long-term investment
performance, current and future asset allocation, and estimates of future long-term returns by asset class. We attempt to
maintain our target asset allocation by rebalancing between asset classes as we make contributions and monthly benefit
payments.
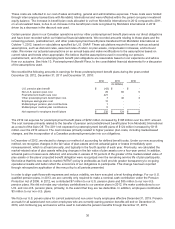
While we do not anticipate further changes in the 2013 assumptions for our U.S. and non-U.S. pension and postretirement
health care plans, as a sensitivity measure, a fifty-basis point change in our discount rate or a fifty-basis point change in
the actual rate of return on plan assets would have the following effects, increase / (decrease) in cost, as of December 29,
2012:
U.S. Plans Non-US. Plans
Fifty-Basis-Point Fifty-Basis-Point
Increase Decrease Increase Decrease
(in millions)
Effect of change in discount rate on pension costs $ (516) $ 583 $ (94) $ 102
Effect of change in actual rate of return
on plan assets on pension costs (28) 28 (6) 6
Effect of change in discount rate on
postretirement health care costs (208) 232 (12) 14
Income Taxes:
We recognize tax benefits when they have a greater than 50 percent likelihood of being realized upon ultimate settlement.
We recognize deferred tax assets for temporary differences, operating loss carryforwards, and tax credit carryforwards.
We reduce deferred tax assets by a valuation allowance if it is more likely than not that some portion, or all, of the deferred
tax assets will not be realized.
New Accounting Guidance
See Note 1, Summary of Significant Accounting Policies, to the consolidated financial statements for a discussion of new
accounting standards.
Contingencies
See Note 12, Commitments and Contingencies, to the consolidated financial statements.
Commodity Trends
We purchase large quantities of commodities, including dairy products, coffee beans, meat products, wheat, corn
products, soybean and vegetable oils, nuts, and sugar and other sweeteners. In addition, we use significant quantities of
resins and cardboard to package our products, and natural gas to operate our factories and warehouses. We continuously
monitor worldwide supply and cost trends of these commodities.
37