Kraft 2012 Annual Report Download - page 55
Download and view the complete annual report
Please find page 55 of the 2012 Kraft annual report below. You can navigate through the pages in the report by either clicking on the pages listed below, or by using the keyword search tool below to find specific information within the annual report.-
 1
1 -
2
-
3
-
4
-
5
-
6
-
7
-
8
-
9
-
10
-
11
-
12
-
13
-
14
-
15
-
16
-
17
-
18
-
19
-
20
-
21
-
22
-
23
-
24
-
25
-
26
-
27
-
28
-
29
-
30
-
31
-
32
-
33
-
34
-
35
-
36
-
37
-
38
-
39
-
40
-
41
-
42
-
43
-
44
-
 45
45 -
 46
46 -
 47
47 -
 48
48 -
 49
49 -
 50
50 -
 51
51 -
 52
52 -
 53
53 -
 54
54 -
 55
55 -
 56
56 -
 57
57 -
 58
58 -
 59
59 -
 60
60 -
 61
61 -
 62
62 -
 63
63 -
 64
64 -
 65
65 -
66
-
67
-
68
-
69
-
70
-
71
-
72
-
73
-
74
-
75
-
76
-
77
-
78
-
79
-
80
-
81
-
82
-
83
-
84
-
85
-
86
-
87
-
88
-
89
-
90
-
91
-
92
-
93
-
94
-
95
-
96
-
97
 |
 |

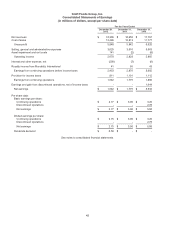
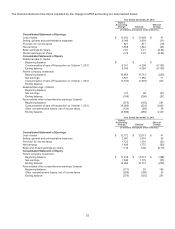
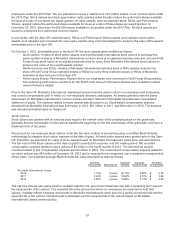
The financial statement line items impacted by the change to MTM accounting are summarized below.
Year Ended December 29, 2012
Before
Accounting
Change Revised
Effect of
Change
(in millions, except per share amounts)
Consolidated Statement of Earnings
Cost of sales $ 12,452 $ 12,499 $ 47
Selling, general and administrative expenses 3,040 3,029 (11)
Provision for income taxes 821 811 (10)
Net earnings 1,668 1,642 (26)
Basic earnings per share 2.81 2.77 (0.04)
Diluted earnings per share 2.79 2.75 (0.04)
Consolidated Statement of Equity
Additional paid-in capital
Beginning balance $ - $ - $ -
Consummation of spin-off transaction on October 1, 2012 8,311 4,208 (4,103)
Ending balance 8,343 4,240 (4,103)
Parent company investment
Beginning balance 16,966 16,713 (253)
Net earnings 1,541 1,552 11
Consummation of spin-off transaction on October 1, 2012 (7,912) (7,670) 242
Ending balance ---
Retained Earnings / (deficit)
Beginning balance ---
Net earnings 127 90 (37)
Ending balance (169) (206) (37)
Accumulated other comprehensive earnings/ (losses)
Beginning balance (376) (125) 251
Consummation of spin-off transaction on October 1, 2012 (4,096) (233) 3,863
Other comprehensive losses, net of income taxes (124) (98) 26
Ending balance (4,600) (460) 4,140
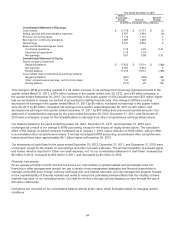
Year Ended December 31, 2011
Before
Accounting
Change Revised
Effect of
Change
(in millions, except per share amounts)
Consolidated Statement of Earnings
Cost of sales $ 12,772 $ 12,813 $ 41
Selling, general and administrative expenses 2,981 3,016 35
Provision for income taxes 1,122 1,101 (21)
Net earnings 1,830 1,775 (55)
Basic and diluted earnings per share 3.10 3.00 (0.10)
Consolidated Statement of Equity
Parent company investment
Beginning balance $ 17,210 $ 17,012 $ (198)
Net earnings 1,830 1,775 (55)
Ending balance 16,966 16,713 (253)
Accumulated other comprehensive earnings/ (losses)
Beginning balance (171) 25 196
Other comprehensive losses, net of income taxes (205) (150) 55
Ending balance (376) (125) 251
53