Kraft 2012 Annual Report Download - page 82
Download and view the complete annual report
Please find page 82 of the 2012 Kraft annual report below. You can navigate through the pages in the report by either clicking on the pages listed below, or by using the keyword search tool below to find specific information within the annual report.-
 1
1 -
2
-
3
-
4
-
5
-
6
-
7
-
8
-
9
-
10
-
11
-
12
-
13
-
14
-
15
-
16
-
17
-
18
-
19
-
20
-
21
-
22
-
23
-
24
-
25
-
26
-
27
-
28
-
29
-
30
-
31
-
32
-
33
-
34
-
35
-
36
-
37
-
38
-
39
-
40
-
41
-
42
-
43
-
44
-
45
-
46
-
47
-
48
-
49
-
50
-
51
-
52
-
53
-
54
-
55
-
56
-
57
-
58
-
59
-
60
-
61
-
62
-
63
-
64
-
65
-
66
-
67
-
68
-
69
-
70
-
71
-
 72
72 -
 73
73 -
 74
74 -
 75
75 -
 76
76 -
 77
77 -
 78
78 -
 79
79 -
 80
80 -
 81
81 -
 82
82 -
 83
83 -
 84
84 -
 85
85 -
 86
86 -
 87
87 -
 88
88 -
 89
89 -
 90
90 -
 91
91 -
 92
92 -
93
-
94
-
95
-
96
-
97
 |
 |

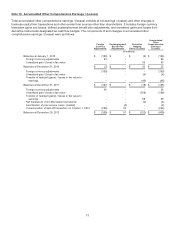
In connection with our Restructuring Program, we recorded restructuring charges of $141 million, implementation costs of
$131 million, and Spin-Off transition costs of $31 million in 2012. We recorded the restructuring charges in operations, as
a part of asset impairment and exit costs, the implementation costs in operations, as a part of cost of sales and selling,
general and administrative expenses, and the Spin-Off transition costs in operations, as part of selling, general and
administrative expenses. See Note 6, Restructuring Program, for restructuring costs by segment.
Included within our segment results are sales to Mondele¯ z International which totaled $114 million in 2012, $100 million in
2011, and $79 million in 2010.
Total assets, depreciation expense and capital expenditures by segment were:
As of
December 29,
2012
December 31,
2011
(in millions)
Total assets:
Beverages $ 2,547 $ 2,836
Cheese 4,355 4,156
Refrigerated Meals 2,234 2,151
Grocery 7,809 7,723
International & Foodservice 3,924 3,194
Unallocated assets (1) 2,460 1,479
Total assets $ 23,329 $ 21,539
(1) Unallocated assets consist primarily of cash and cash equivalents, deferred income taxes, centrally held property, plant and equipment,
prepaid pension assets, and derivative financial instrument balances.
For the Years Ended
December 29,
2012
December 31,
2011
December 31,
2010
(in millions)
Depreciation expense:
Beverages $ 72 $ 66 $ 73
Cheese 119 80 67
Refrigerated Meals 76 83 61
Grocery 94 97 98
International & Foodservice 67 38 38
Total - continuing operations 428 364 337
Discontinued operations - - 17
Total depreciation expense $ 428 $ 364 $ 354
Depreciation expense includes accelerated depreciation on assets. See Note 6, Restructuring Program, for more
information.
For the Years Ended
December 29,
2012
December 31,
2011
December 31,
2010
(in millions)
Capital expenditures:
Beverages $ 129 $ 121 $ 88
Cheese 84 72 88
Refrigerated Meals 83 88 109
Grocery 100 79 96
International & Foodservice 44 41 65
Total - continuing operations 440 401 446
Discontinued operations - - 2
Total capital expenditures $ 440 $ 401 $ 448
80