Kraft 2012 Annual Report Download - page 22
Download and view the complete annual report
Please find page 22 of the 2012 Kraft annual report below. You can navigate through the pages in the report by either clicking on the pages listed below, or by using the keyword search tool below to find specific information within the annual report.-
 1
1 -
2
-
3
-
4
-
5
-
6
-
7
-
8
-
9
-
10
-
11
-
 12
12 -
 13
13 -
 14
14 -
 15
15 -
 16
16 -
 17
17 -
 18
18 -
 19
19 -
 20
20 -
 21
21 -
 22
22 -
 23
23 -
 24
24 -
 25
25 -
 26
26 -
 27
27 -
 28
28 -
 29
29 -
 30
30 -
 31
31 -
 32
32 -
33
-
34
-
35
-
36
-
37
-
38
-
39
-
40
-
41
-
42
-
43
-
44
-
45
-
46
-
47
-
48
-
49
-
50
-
51
-
52
-
53
-
54
-
55
-
56
-
57
-
58
-
59
-
60
-
61
-
62
-
63
-
64
-
65
-
66
-
67
-
68
-
69
-
70
-
71
-
72
-
73
-
74
-
75
-
76
-
77
-
78
-
79
-
80
-
81
-
82
-
83
-
84
-
85
-
86
-
87
-
88
-
89
-
90
-
91
-
92
-
93
-
94
-
95
-
96
-
97
 |
 |
PART II
Item 5. Market for Registrant’s Common Equity, Related Stockholder Matters and Issuer Purchases of Equity
Securities.
Our common stock is listed on the NASDAQ Global Select Market (“NASDAQ”). At February 23, 2013, there were
approximately 73,071 holders of record of our common stock.
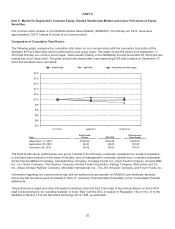
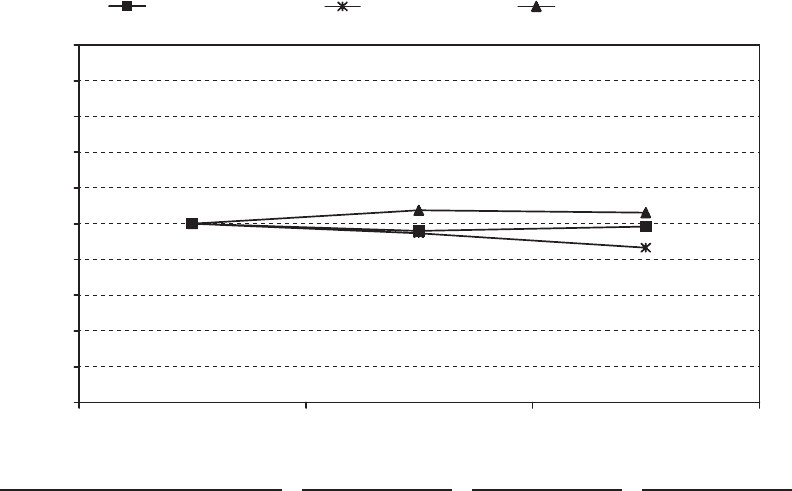
Comparison of Cumulative Total Return
The following graph compares the cumulative total return on our common stock with the cumulative total return of the
Standard & Poor’s 500 Index and the performance peer group index. This graph covers the period from September 17,
2012 (the first day our common stock began “when-issued” trading on the NASDAQ) through December 28, 2012 (the last
trading day of our fiscal year). The graph shows total shareholder return assuming $100 was invested on September 17,
2012 and dividends were reinvested.
$75
$85
$90
$80
$95
$100
$105
$110
$115
$120
$125
9/17/2012 9/28/2012 12/28/2012
Kraft Foods Performance Peer Group
S&P 500
Date
Kraft Foods
Group S&P 500
Performance
Peer Group
September 17, 2012 $100.00 $100.00 $100.00
September 28, 2012 98.97 98.65 101.87
December 28, 2012 99.59 96.64 101.55
The Kraft Foods Group performance peer group consists of the following companies considered our market competitors,
or that have been selected on the basis of industry, level of management complexity, global focus or industry leadership:
Archer Daniels Midland Company, Campbell Soup Company, ConAgra Foods, Inc., Dean Foods Company, General Mills,
Inc., H.J. Heinz Company, The Hershey Company, Hormel Foods Corporation, Kellogg Company, McCormick and Co.
Inc., Mead Johnson Nutrition Company, Mondele¯ z International, Inc., The J.M. Smucker Company, and Tyson Foods, Inc.
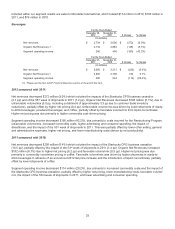
Information regarding our common stock high and low sales prices as reported on NASDAQ and dividends declared
during the last two fiscal years is included in Note 17, Quarterly Financial Data (Unaudited), to the consolidated financial
statements.
This performance graph and other information furnished under this Part II Item 5(a) of this Annual Report on Form 10-K
shall not be deemed to be “soliciting material” or to be “filed” with the SEC or subject to Regulation 14A or 14C, or to the
liabilities of Section 18 of the Securities Exchange Act of 1934, as amended.
20