Kraft 2012 Annual Report Download - page 44
Download and view the complete annual report
Please find page 44 of the 2012 Kraft annual report below. You can navigate through the pages in the report by either clicking on the pages listed below, or by using the keyword search tool below to find specific information within the annual report.-
 1
1 -
2
-
3
-
4
-
5
-
6
-
7
-
8
-
9
-
10
-
11
-
12
-
13
-
14
-
15
-
16
-
17
-
18
-
19
-
20
-
21
-
22
-
23
-
24
-
25
-
26
-
27
-
28
-
29
-
30
-
31
-
32
-
33
-
 34
34 -
 35
35 -
 36
36 -
 37
37 -
 38
38 -
 39
39 -
 40
40 -
 41
41 -
 42
42 -
 43
43 -
 44
44 -
 45
45 -
 46
46 -
 47
47 -
 48
48 -
 49
49 -
 50
50 -
 51
51 -
 52
52 -
 53
53 -
 54
54 -
55
-
56
-
57
-
58
-
59
-
60
-
61
-
62
-
63
-
64
-
65
-
66
-
67
-
68
-
69
-
70
-
71
-
72
-
73
-
74
-
75
-
76
-
77
-
78
-
79
-
80
-
81
-
82
-
83
-
84
-
85
-
86
-
87
-
88
-
89
-
90
-
91
-
92
-
93
-
94
-
95
-
96
-
97
 |
 |

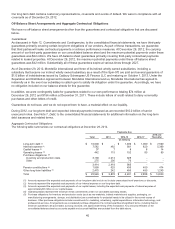
Our non-GAAP financial measures reflect how we evaluate our operating results currently. As new events or
circumstances arise, these definitions could change over time. We use “Organic Net Revenues” in this Annual Report on
Form 10-K, which is defined as net revenues excluding the impact of transactions with Mondele¯z International,
acquisitions, divestitures (including the termination of a full line of business due to the loss of a licensing or distribution
arrangement, and the complete exit of business out of a foreign country), currency, and the 53rd week of shipments in
2011.
We believe that the presentation of this non-GAAP financial measure, when considered together with our U.S. GAAP
financial measure and the reconciliations to the corresponding U.S. GAAP financial measure, provides you with a more
complete understanding of the factors and trends affecting our business than could be obtained absent these disclosures.
Because non-GAAP financial measures may vary among other companies, the Organic Net Revenue measure we present
in the Consolidated Results of Operations section may not be comparable to the similarly titled measure used by other
companies. Our use of this non-GAAP financial measure is not meant to be considered in isolation or as a substitute for
any U.S. GAAP financial measure. A limitation of non-GAAP financial measures is that they exclude items detailed below
which have an impact on U.S. GAAP reported results. The best way this limitation can be addressed is by evaluating our
Organic Net Revenue measure in combination with our U.S. GAAP reported results and carefully evaluating the tables
which reconcile U.S. GAAP reported figures to the non-GAAP financial measure.
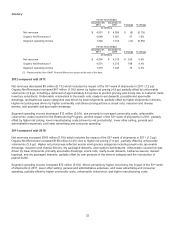
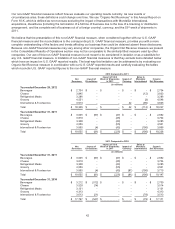
2012 Compared to 2011
Net
Revenues
Impact of
Divestitures
Impact of 53rd
Week of Shipments
in 2011
Impact of
Currency
Sales to
Mondele¯z
International
Organic
Net Revenues
(in millions)
Year ended December 29, 2012
Beverages $ 2,734 $ - $ - $ - $ - $ 2,734
Cheese 3,845 - - - (12) 3,833
Refrigerated Meals 3,296 - - - - 3,296
Grocery 4,551 - - - (3) 4,548
International & Foodservice 3,913 - - 22 (99) 3,836
Total $ 18,339 $ - $ - $ 22 $ (114) $ 18,247
Year ended December 31, 2011
Beverages $ 3,006 $ (87) $ (37) $ - $ - $ 2,882
Cheese 3,810 - (46) - - 3,764
Refrigerated Meals 3,328 - (43) - - 3,285
Grocery 4,556 - (55) - - 4,501
International & Foodservice 3,955 (4) (45) - (100) 3,806
Total $ 18,655 $ (91) $ (226) $ - $ (100) $ 18,238
2011 Compared to 2010
Net
Revenues
Impact of
Divestitures
Impact of 53rd
Week of Shipments
in 2011
Impact of
Currency
Sales to
Mondele¯z
International
Organic
Net Revenues
(in millions)
Year ended December 31, 2011
Beverages $ 3,006 $ (87) $ (37) $ - $ - $ 2,882
Cheese 3,810 - (46) - - 3,764
Refrigerated Meals 3,328 - (43) - - 3,285
Grocery 4,556 - (55) - - 4,501
International & Foodservice 3,955 (4) (45) (91) (100) 3,715
Total $ 18,655 $ (91) $ (226) $ (91) $ (100) $ 18,147
Year ended December 31, 2010
Beverages $ 3,212 $ (512) $ - $ - $ - $ 2,700
Cheese 3,528 (14) - - - 3,514
Refrigerated Meals 3,131 - - - - 3,131
Grocery 4,313 - - - - 4,313
International & Foodservice 3,613 (21) - - (79) 3,513
Total $ 17,797 $ (547) $ - $ - $ (79) $ 17,171
42