Kraft 2012 Annual Report Download - page 40
Download and view the complete annual report
Please find page 40 of the 2012 Kraft annual report below. You can navigate through the pages in the report by either clicking on the pages listed below, or by using the keyword search tool below to find specific information within the annual report.-
 1
1 -
2
-
3
-
4
-
5
-
6
-
7
-
8
-
9
-
10
-
11
-
12
-
13
-
14
-
15
-
16
-
17
-
18
-
19
-
20
-
21
-
22
-
23
-
24
-
25
-
26
-
27
-
28
-
29
-
 30
30 -
 31
31 -
 32
32 -
 33
33 -
 34
34 -
 35
35 -
 36
36 -
 37
37 -
 38
38 -
 39
39 -
 40
40 -
 41
41 -
 42
42 -
 43
43 -
 44
44 -
 45
45 -
 46
46 -
 47
47 -
 48
48 -
 49
49 -
 50
50 -
51
-
52
-
53
-
54
-
55
-
56
-
57
-
58
-
59
-
60
-
61
-
62
-
63
-
64
-
65
-
66
-
67
-
68
-
69
-
70
-
71
-
72
-
73
-
74
-
75
-
76
-
77
-
78
-
79
-
80
-
81
-
82
-
83
-
84
-
85
-
86
-
87
-
88
-
89
-
90
-
91
-
92
-
93
-
94
-
95
-
96
-
97
 |
 |
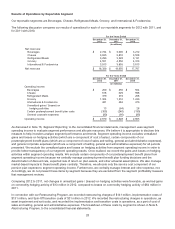
The most significant cost component of our cheese products are dairy commodities, including milk and cheese. We
purchase our dairy raw material requirements from independent third parties such as agricultural cooperatives and
independent processors. Market supply and demand, as well as government programs substantially influence the price for
milk and other dairy products. The most significant cost component of our coffee products is coffee beans, which we
purchase on world markets. Quality and availability of supply, changes in the value of the U.S. dollar in relation to certain
other currencies, and consumer demand for coffee products impact coffee bean prices. Significant cost components in our
meat business include pork, beef, and poultry, which we purchase on domestic markets. Livestock feed costs and the
global demand for U.S. meats influence the prices of these meat products. Other significant cost components in our
grocery products are grains, including wheat, sugar, and soybean oil.
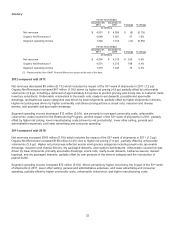
During 2012, our aggregate commodity costs increased over the prior year, primarily as a result of higher costs of nuts,
sugar, packaging materials, other raw materials, energy, flour and grain costs, meat products, and oils, partially offset by
lower dairy and coffee costs. Our commodity costs increased approximately $0.2 billion in 2012 and $1.0 billion in 2011
compared to the prior year. We have addressed higher commodity costs primarily through higher pricing.
Liquidity and Capital Resources
We believe that cash generated from our operating activities, our $3.0 billion revolving credit facility, and our commercial
paper program will provide sufficient liquidity to meet our working capital needs, expected Restructuring Program
expenditures, planned capital expenditures, our planned voluntary contributions to our postemployment benefit plans,
future contractual obligations, and payment of our anticipated quarterly dividends. We will use our cash and commercial
paper program for daily funding requirements. Overall, we do not expect any negative effects on our funding sources that
would have a material effect on our short-term or long-term liquidity.
Historically, certain cash balances were swept by Mondele¯z International, and we received funding from Mondele¯z
International for our operating and investing cash needs. As agreed under the Separation and Distribution Agreement
between Mondele¯ z International and us, they retained the cash swept by Mondele¯ z International prior to the Spin-Off. We
expect to finance short-term cash needs through our existing cash balance, cash from our operating activities, our
commercial paper program, and our $3.0 billion revolving credit facility.
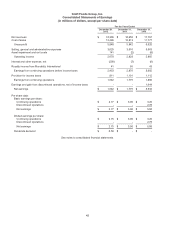
Net Cash Provided by Operating Activities:
Operating activities provided net cash of $3.0 billion in 2012, $2.7 billion in 2011, and $828 million in 2010. The increase in
operating cash flows in 2012 is primarily related to earnings, partially offset by higher interest payments on our long term
debt. Our results included $418 million of deferred tax adjustments as a result of our $3.6 billion debt exchange. The
increase in operating cash flows in 2011 primarily related to the prior year payment of taxes in connection with the 2010
Frozen Pizza divestiture and the favorable timing of the collection of receivables and the payment of our accounts payable,
partially offset by increased inventory levels.
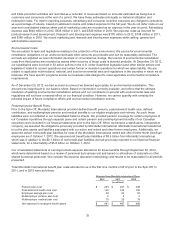
Net Cash Provided by / (Used in) Investing Activities:
Net cash used in investing activities was $422 million in 2012 and $401 million in 2011. Net cash provided by investing
activities was $3.3 billion in 2010. The increase in cash used in investing activities in 2012 primarily related to increased
capital expenditures partially offset by proceeds from the sale of property, plant and equipment. In 2010, we received $3.7
billion in proceeds from the sale of the Frozen Pizza business.
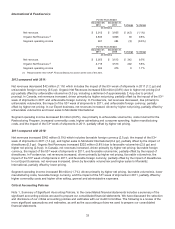
Capital expenditures were $440 million in 2012, $401 million in 2011, and $448 million in 2010. The 2012 capital
expenditures were primarily used to modernize manufacturing facilities and support new product and productivity
initiatives. We expect 2013 capital expenditures to be up to $700 million, including capital expenditures required for our
Restructuring Program and IT systems investments. We expect to fund these expenditures from operations.
Net Cash Used in Financing Activities:
Net cash used in financing activities was $1.4 billion in 2012, $2.3 billion in 2011, and $4.1 billion in 2010. The net cash
used in 2012 primarily related to $7.2 billion of net transfers to Mondele¯ z International partially offset by the net proceeds
we received from our $6.0 billion debt issuance. The net cash used in financing activities in 2011 and 2010 primarily
related to net transfers to Mondele¯ z International.
Borrowing Arrangements:
On March 8, 2012, in connection with the Spin-Off, we entered into a $4.0 billion 364-day senior unsecured revolving
credit facility that was to expire on March 7, 2013. On September 24, 2012, we terminated this facility with no amounts
drawn.
38