Kraft 2012 Annual Report Download - page 68
Download and view the complete annual report
Please find page 68 of the 2012 Kraft annual report below. You can navigate through the pages in the report by either clicking on the pages listed below, or by using the keyword search tool below to find specific information within the annual report.-
 1
1 -
2
-
3
-
4
-
5
-
6
-
7
-
8
-
9
-
10
-
11
-
12
-
13
-
14
-
15
-
16
-
17
-
18
-
19
-
20
-
21
-
22
-
23
-
24
-
25
-
26
-
27
-
28
-
29
-
30
-
31
-
32
-
33
-
34
-
35
-
36
-
37
-
38
-
39
-
40
-
41
-
42
-
43
-
44
-
45
-
46
-
47
-
48
-
49
-
50
-
51
-
52
-
53
-
54
-
55
-
56
-
57
-
 58
58 -
 59
59 -
 60
60 -
 61
61 -
 62
62 -
 63
63 -
 64
64 -
 65
65 -
 66
66 -
 67
67 -
 68
68 -
 69
69 -
 70
70 -
 71
71 -
 72
72 -
 73
73 -
 74
74 -
 75
75 -
 76
76 -
 77
77 -
 78
78 -
79
-
80
-
81
-
82
-
83
-
84
-
85
-
86
-
87
-
88
-
89
-
90
-
91
-
92
-
93
-
94
-
95
-
96
-
97
 |
 |

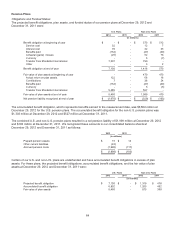
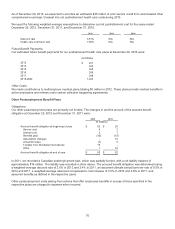
We used the following weighted-average assumptions to determine our net pension cost for the years ended
December 29, 2012 and December 31, 2011:
U.S. Plans Non-U.S. Plans
2012 2011 2010 2012 2011 2010
Discount rate 3.85% N/A N/A 4.03% 5.00% 5.25%
Expected rate of return on plan assets 8.00% N/A N/A 7.04% 7.36% 7.36%
Rate of compensation increase 4.00% N/A N/A 3.00% 3.00% 3.00%
Year-end discount rates for our U.S. and non-U.S. plans were developed from a model portfolio of high quality,
fixed-income debt instruments with durations that match the expected future cash flows of the benefit obligations. We
determine our expected rate of return on plan assets from the plan assets’ historical long-term investment performance,
current and future asset allocation, and estimates of future long-term returns by asset class.
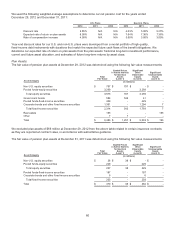
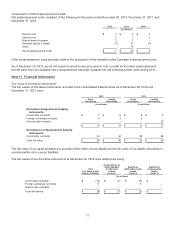
Plan Assets:
The fair value of pension plan assets at December 29, 2012 was determined using the following fair value measurements:
Asset Category
Total
Fair Value
Quoted Prices
in Active Markets
for Identical
Assets
(Level 1)
Significant
Other
Observable
Inputs
(Level 2)
Significant
Unobservable
Inputs
(Level 3)
(in millions)
Non-U.S. equity securities $ 707 $ 707 $ - $ -
Pooled funds-equity securities 3,269 - 3,269 -
Total equity securities 3,976 707 3,269 -
Government bonds 584 543 41 -
Pooled funds-fixed-income securities 429 - 429 -
Corporate bonds and other fixed-income securities 1,301 - 1,294 7
Total fixed-income securities 2,314 543 1,764 7
Real estate 186 - - 186
Other 7 7 - -
Total $ 6,483 $ 1,257 $ 5,033 $ 193
We excluded plan assets of $66 million at December 29, 2012 from the above table related to certain insurance contracts
as they are reported at contract value, in accordance with authoritative guidance.
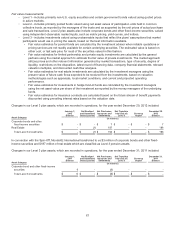
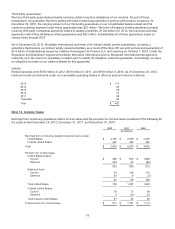
The fair value of pension plan assets at December 31, 2011 was determined using the following fair value measurements:
Asset Category
Total
Fair Value
Quoted Prices
in Active Markets
for Identical
Assets
(Level 1)
Significant
Other
Observable
Inputs
(Level 2)
Significant
Unobservable
Inputs
(Level 3)
(in millions)
Non-U.S. equity securities $ 38 $ 38 $ - $ -
Pooled funds-equity securities 229 - 229 -
Total equity securities 267 38 229 -
Pooled funds-fixed-income securities 197 - 197 -
Corporate bonds and other fixed-income securities 6 - 6 -
Total fixed-income securities 203 - 203 -
Total $ 470 $ 38 $ 432 $ -
66