Kodak 2013 Annual Report Download - page 83
Download and view the complete annual report
Please find page 83 of the 2013 Kodak annual report below. You can navigate through the pages in the report by either clicking on the pages listed below, or by using the keyword search tool below to find specific information within the annual report.-
 1
1 -
2
-
3
-
4
-
5
-
6
-
7
-
8
-
9
-
10
-
11
-
12
-
13
-
14
-
15
-
16
-
17
-
18
-
19
-
20
-
21
-
22
-
23
-
24
-
25
-
26
-
27
-
28
-
29
-
30
-
31
-
32
-
33
-
34
-
35
-
36
-
37
-
38
-
39
-
40
-
41
-
42
-
43
-
44
-
45
-
46
-
47
-
48
-
49
-
50
-
51
-
52
-
53
-
54
-
55
-
56
-
57
-
58
-
59
-
60
-
61
-
62
-
63
-
64
-
65
-
66
-
67
-
68
-
69
-
70
-
71
-
72
-
 73
73 -
 74
74 -
 75
75 -
 76
76 -
 77
77 -
 78
78 -
 79
79 -
 80
80 -
 81
81 -
 82
82 -
 83
83 -
 84
84 -
 85
85 -
 86
86 -
 87
87 -
 88
88 -
 89
89 -
 90
90 -
 91
91 -
 92
92 -
 93
93 -
94
-
95
-
96
-
97
-
98
-
99
-
100
-
101
-
102
-
103
-
104
-
105
-
106
-
107
-
108
-
109
-
110
-
111
-
112
-
113
-
114
-
115
-
116
-
117
-
118
-
119
-
120
-
121
-
122
-
123
-
124
-
125
-
126
-
127
-
128
-
129
-
130
-
131
-
132
-
133
-
134
-
135
-
136
-
137
-
138
-
139
-
140
-
141
-
142
-
143
-
144
-
145
-
146
-
147
-
148
-
149
-
150
-
151
-
152
-
153
-
154
-
155
-
156
-
157
-
158
-
159
-
160
-
161
-
162
-
163
-
164
-
165
-
166
-
167
-
168
-
169
-
170
-
171
-
172
-
173
-
174
-
175
-
176
-
177
-
178
 |
 |

Table of Contents
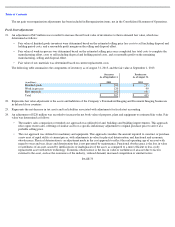
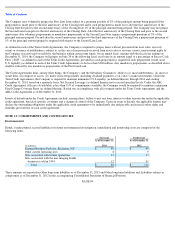
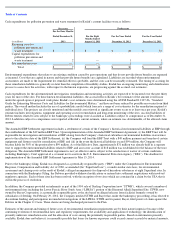
NOTE 6: INVENTORIES, NET
NOTE 7: PROPERTY, PLANT AND EQUIPMENT, NET
In connection with the application of fresh start accounting as of September 1, 2013, Kodak recorded fair value adjustments disclosed in Note
3, “Fresh Start Accounting”. Accumulated depreciation was therefore eliminated as of that date.
Depreciation expense was $67 million, $91 million, $182 million, and $221 million for the four months ended December 31, 2013, eight
months ended August 31, 2013 and the years 2012, and 2011 respectively, of which approximately $0 million, $4 million, $13 million, and $10
million, respectively, represented accelerated depreciation in connection with restructuring actions.
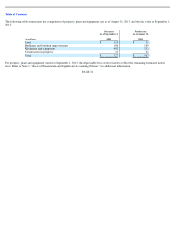
NOTE 8: GOODWILL AND OTHER INTANGIBLE ASSETS
The following table presents the changes in the carrying value of goodwill by reportable segment:
PAGE 78
Successor
Predecessor
(in millions)
As of December 31,
2013
As of December 31,
2012
Finished goods
$
185
$
236
Work in process
94
87
Raw materials
79
97
Total
$
358
$
420
Successor
Predecessor
(in millions)
As of December 31,
2013
As of December 31,
2012
Land
$
117
$
39
Buildings and building improvements
178
1,156
Machinery and equipment
414
3,138
Construction in progress
42
28
751
4,361
Accumulated depreciation
(67
)
(3,754
)
Property, plant and equipment, net
$
684
$
607
(in millions)
Graphics, Entertainment
and Commercial Films
Segment
Digital Printing and
Enterprise Segment
Consolidated
Total
Balance as of December 31, 2011 and 2012 (Predecessor):
$
115
$
17
$
132
Impairment
(77
)
—
(
77
)
Currency translation adjustments
1
—
1
Balance as of August 31, 2013 (Predecessor):
$
39
$
17
$
56
Impact of fresh start accounting
$
22
$
10
$
32
Balance as of December 31, 2013 (Successor):
$
61
$
27
$
88