Kodak 2013 Annual Report Download - page 133
Download and view the complete annual report
Please find page 133 of the 2013 Kodak annual report below. You can navigate through the pages in the report by either clicking on the pages listed below, or by using the keyword search tool below to find specific information within the annual report.-
 1
1 -
2
-
3
-
4
-
5
-
6
-
7
-
8
-
9
-
10
-
11
-
12
-
13
-
14
-
15
-
16
-
17
-
18
-
19
-
20
-
21
-
22
-
23
-
24
-
25
-
26
-
27
-
28
-
29
-
30
-
31
-
32
-
33
-
34
-
35
-
36
-
37
-
38
-
39
-
40
-
41
-
42
-
43
-
44
-
45
-
46
-
47
-
48
-
49
-
50
-
51
-
52
-
53
-
54
-
55
-
56
-
57
-
58
-
59
-
60
-
61
-
62
-
63
-
64
-
65
-
66
-
67
-
68
-
69
-
70
-
71
-
72
-
73
-
74
-
75
-
76
-
77
-
78
-
79
-
80
-
81
-
82
-
83
-
84
-
85
-
86
-
87
-
88
-
89
-
90
-
91
-
92
-
93
-
94
-
95
-
96
-
97
-
98
-
99
-
100
-
101
-
102
-
103
-
104
-
105
-
106
-
107
-
108
-
109
-
110
-
111
-
112
-
113
-
114
-
115
-
116
-
117
-
118
-
119
-
120
-
121
-
122
-
 123
123 -
 124
124 -
 125
125 -
 126
126 -
 127
127 -
 128
128 -
 129
129 -
 130
130 -
 131
131 -
 132
132 -
 133
133 -
 134
134 -
 135
135 -
 136
136 -
 137
137 -
 138
138 -
 139
139 -
 140
140 -
 141
141 -
 142
142 -
 143
143 -
144
-
145
-
146
-
147
-
148
-
149
-
150
-
151
-
152
-
153
-
154
-
155
-
156
-
157
-
158
-
159
-
160
-
161
-
162
-
163
-
164
-
165
-
166
-
167
-
168
-
169
-
170
-
171
-
172
-
173
-
174
-
175
-
176
-
177
-
178
 |
 |
Table of Contents
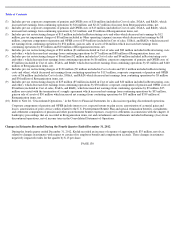
PAGE 126
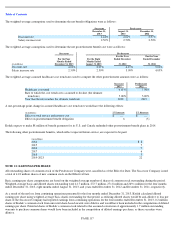
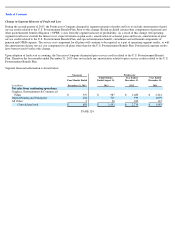
Successor
Predecessor
(in millions)
Four Months Ended
December 31, 2013
Eight Months
Ended August 31,
2013
Year Ended
December 31, 2012
Year Ended
December 31, 2011
Intangible asset amortization
expense from continuing
operations:
Graphics, Entertainment and
Commercial Films
$
3
$
7
$
21
$
33
Digital Printing and Enterprise
5
3
5
6
Consolidated total
$
8
$
10
$
26
$
39
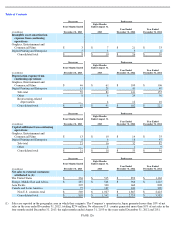
Successor
Predecessor
(in millions)
Four Months Ended
December 31, 2013
Eight Months
Ended August 31,
2013
Year Ended
December 31, 2012
Year Ended
December 31, 2011
Depreciation expense from
continuing operations:
Graphics, Entertainment and
Commercial Films
$
46
$
61
$
100
$
106
Digital Printing and Enterprise
13
20
41
49
Sub
-
total
59
81
141
155
Other
8
6
29
56
Restructuring-related
depreciation
—
4
12
10
Consolidated total
$
67
$
91
$
182
$
221
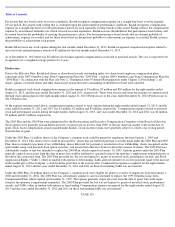
Successor
Predecessor
(in millions)
Four Months Ended
December 31, 2013
Eight Months
Ended August 31,
2013
Year Ended
December 31, 2012
Year Ended
December 31, 2011
Capital additions from continuing
operations:
Graphics, Entertainment and
Commercial Films
$
13
$
10
$
14
$
35
Digital Printing and Enterprise
8
6
18
47
Sub
-
total
21
16
32
82
Other
—
2
1
9
Consolidated total
$
21
$
18
$
33
$
91
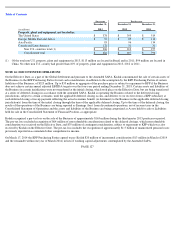
Successor
Predecessor
(in millions)
Four Months Ended
December 31, 2013
Eight Months
Ended August 31,
2013
Year Ended
December 31, 2012
Year Ended
December 31, 2011
Net sales to external customers
attributed to (1):
The United States
$
236
$
515
$
852
$
1,162
Europe, Middle East and Africa
$
287
$
548
$
966
$
1,225
Asia Pacific
207
330
660
808
Canada and Latin America
75
149
241
390
Non U.S. countries total
$
569
$
1,027
$
1,867
$
2,423
Consolidated total
$
805
$
1,542
$
2,719
$
3,585
(1) Sales are reported in the geographic area in which they originate. The Company’s operations in Japan generated more than 10% of net
sales in the year ended December 31, 2012, totaling $274 million. No other non-U.S. country generated more than 10% of net sales in the
four months ended December 31, 2013, the eight months ended August 31, 2103 or the years ended December 31, 2012 and 2011.