Kodak 2013 Annual Report Download - page 24
Download and view the complete annual report
Please find page 24 of the 2013 Kodak annual report below. You can navigate through the pages in the report by either clicking on the pages listed below, or by using the keyword search tool below to find specific information within the annual report.-
 1
1 -
2
-
3
-
4
-
5
-
6
-
7
-
8
-
9
-
10
-
11
-
12
-
13
-
 14
14 -
 15
15 -
 16
16 -
 17
17 -
 18
18 -
 19
19 -
 20
20 -
 21
21 -
 22
22 -
 23
23 -
 24
24 -
 25
25 -
 26
26 -
 27
27 -
 28
28 -
 29
29 -
 30
30 -
 31
31 -
 32
32 -
 33
33 -
 34
34 -
35
-
36
-
37
-
38
-
39
-
40
-
41
-
42
-
43
-
44
-
45
-
46
-
47
-
48
-
49
-
50
-
51
-
52
-
53
-
54
-
55
-
56
-
57
-
58
-
59
-
60
-
61
-
62
-
63
-
64
-
65
-
66
-
67
-
68
-
69
-
70
-
71
-
72
-
73
-
74
-
75
-
76
-
77
-
78
-
79
-
80
-
81
-
82
-
83
-
84
-
85
-
86
-
87
-
88
-
89
-
90
-
91
-
92
-
93
-
94
-
95
-
96
-
97
-
98
-
99
-
100
-
101
-
102
-
103
-
104
-
105
-
106
-
107
-
108
-
109
-
110
-
111
-
112
-
113
-
114
-
115
-
116
-
117
-
118
-
119
-
120
-
121
-
122
-
123
-
124
-
125
-
126
-
127
-
128
-
129
-
130
-
131
-
132
-
133
-
134
-
135
-
136
-
137
-
138
-
139
-
140
-
141
-
142
-
143
-
144
-
145
-
146
-
147
-
148
-
149
-
150
-
151
-
152
-
153
-
154
-
155
-
156
-
157
-
158
-
159
-
160
-
161
-
162
-
163
-
164
-
165
-
166
-
167
-
168
-
169
-
170
-
171
-
172
-
173
-
174
-
175
-
176
-
177
-
178
 |
 |

Table of Contents
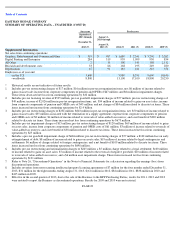
EASTMAN KODAK COMPANY
SUMMARY OF OPERATING DATA – UNAUDITED (CONT’D)
PAGE 22
Successor
Predecessor
September 1
2013 through
December 31,
2013 (9)
January 1,
2013 through
August 31,
2013 (9)
2012 (9)
2011 (9)
2010 (9)
2009 (9)
Supplemental Information
Net sales from continuing operations:
Graphics, Entertainment and Commercial Films
$
519
$
987
$
1,680
$
2,341
$
3,290
$
3,262
Digital Printing and Enterprise
284
519
939
1,099
950
854
All Other
2
36
100
145
198
2,132
Research and development costs
33
66
168
195
249
280
Depreciation
67
91
182
221
318
354
Employees as of year end
-
in the U.S.
3,600
5,980
8,350
9,600
10,630
-
worldwide
8,800
13,100
17,100
18,800
20,250
*
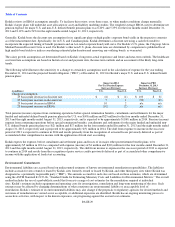
Historical results are not indicative of future results.
1. Includes pre-tax restructuring charges of $17 million; $16 million in pre-tax reorganization items, net; $6 million of income related to
gains on asset sale; income from corporate components of pension and OPEB of $67 million; and $8 million in impairment charges.
These items decreased net loss from continuing operations by $32 million.
2. Includes pre-tax licensing revenue of $535 million, pre-tax goodwill impairment charges of $77 million; pre-tax restructuring charges of
$49 million; income of $2,026 million in pre-tax reorganization items, net; $34 million of income related to gains on asset sales; income
from corporate components of pension and OPEB costs of $43 million; and net charges of $84 million related to discrete tax items. These
items increased net income from continuing operations by $2.4 billion.
3. Includes pre-tax restructuring charges of $232 million; $843 million in pre-tax reorganization items, net; $50 million of income related to
gains on asset sales; $35 million associated with the termination of a supply agreement; expense from corporate components of pension
and OPEB costs of $2 million; $4 million of income related to reversals of value-added tax reserves; and a net benefit of $320 million
related to discrete tax items. These items increased net loss from continuing operations by $673 million.
4. Includes pre-tax impairment charges of $13 million; pre-tax restructuring charges of $120 million; $69 million of income related to gains
on asset sales; income from corporate components of pension and OPEB costs of $61 million; $3 million of income related to reversals of
value-added tax reserves; and a net benefit of $38 million related to discrete tax items. These items increased net loss from continuing
operations by $25 million.
5. Includes a pre-tax goodwill impairment charge of $626 million; pre-tax restructuring charges of $77 million; a $102 million loss on early
extinguishment of debt; $8 million of income related to gains on assets sales; $19 million of income related to legal contingencies and
settlements; $6 million of charges related to foreign contingencies; and a net benefit of $109 million related to discrete tax items. These
items increased net loss from continuing operations by $698 million.
6. Includes pre-tax restructuring and rationalization charges of $245 million; a $5 million charge related to a legal settlement; $100 million
of income related to gains on asset sales; $7 million of income related to the reversal of negative goodwill; $10 million of income related
to reversals of value-added tax reserves; and a $6 million asset impairment charge. These items increased net loss from continuing
operations by $131 million.
7. Refer to Note 26, “Discontinued Operations” in the Notes to Financial Statements for a discussion regarding the earnings (loss) from
discontinued operations.
8. Includes revenues from non-recurring intellectual property licensing agreements of $7 million for the four months ended December 31,
2013, $31 million for the eight months ending August 31, 2013, $(61) million in 2012, $82 million in 2011, $838 million in 2010 and
$435 million in 2009.
9. Effective in the second quarter of 2013, due to the sale of the Business to the KPP Purchasing Parties, results for 2011, 2012 and 2013
were restated to report the Business as discontinued operations. Results for 2009 and 2010 were not restated.